Set points 62, Configuring 62, Bar graph 62 – Maple Systems OIT Family User Manual
Page 62: Set points 62, 72, Set points, Bar graph
Bar Graph
(OIT5400 only)
To configure a PLC Register Monitor to display a bar graph:
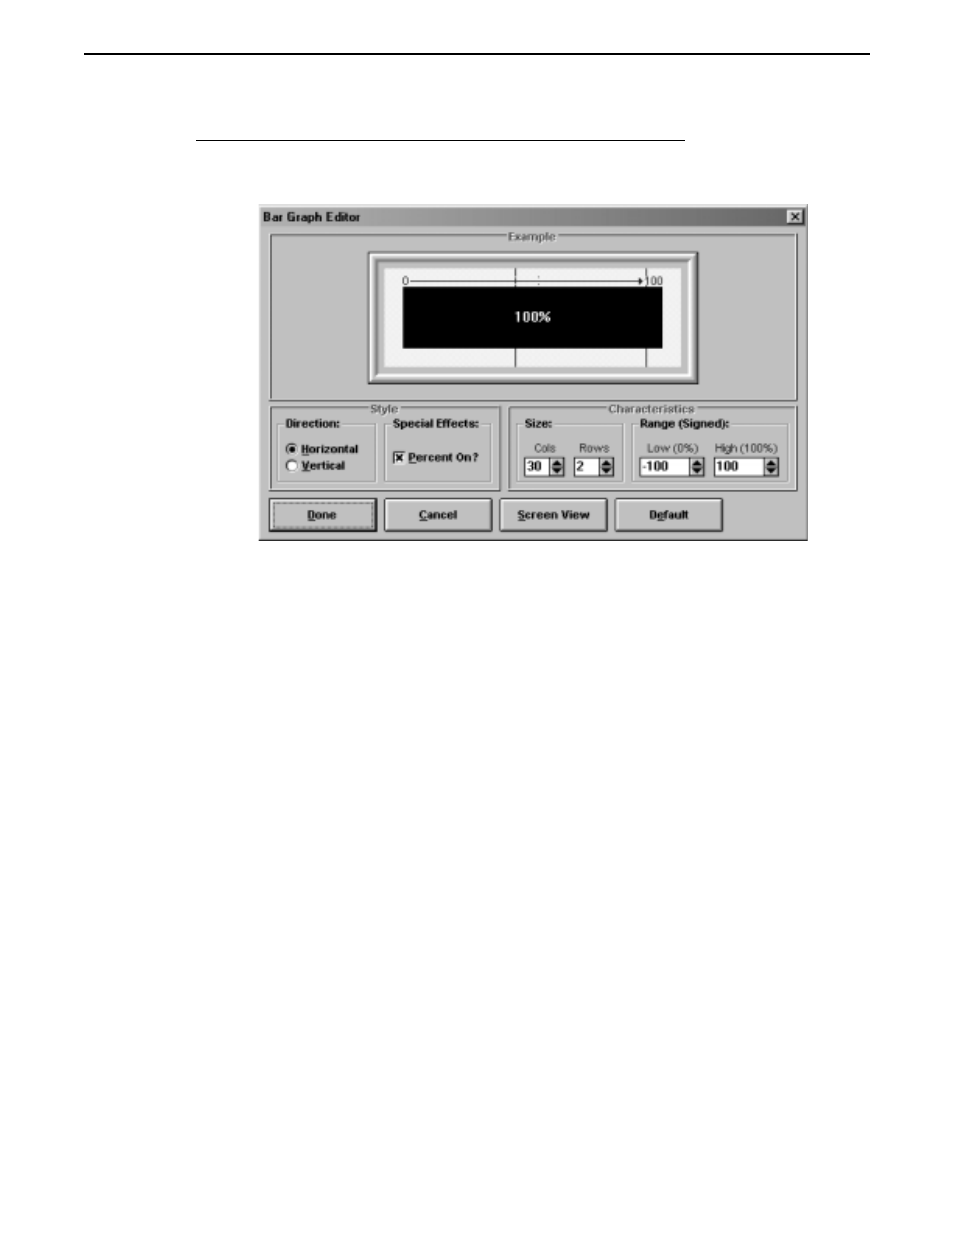
1. In the Register Monitor Editor dialog box, in the Bar Graph group box, choose the
Editor button. The Bar Graph Editor dialog box appears.
2. In the Direction group box, choose the Horizontal or Vertical option button.
3. In the Special Effects group box, select the Percent On? check box if you want to
display the percent in the center of the bar graph.
4. In the Size group box, select the number of columns and rows to use for displaying
the bar graph in the screen.
5. In the Range group box, select the Low and High values to use when establishing the
bar graph range (for example: if the data in the PLC register always falls within -100
to 100, then the low limit should be set to -100 and the high limit to 100).
Set Points
Set Points may be used for a variety of things including system warnings or alarms,
multi-point warnings or alarms, restarting a recipe after a given number of units have
been batch processed, or providing the OIT operator with a choice of actions when a trip
point has been exceeded. Each OIT can have up to 16 set points active simultaneously.
The system programmer provides the following information about each:
•
PLC register address to monitor (known as set point address)
•
format of PLC register (signed, decimal, 4-digit BCD, 8-digit BCD or long)
•
low limit
•
high limit
•
screen number to display upon low limit violation
•
screen number to display upon high limit violation
The set point addresses are monitored continuously by the OIT. The OIT polls one of the
set point addresses every second. Therefore, having 16 set points means each set point is
polled every 16 seconds.
PLC Register Monitors
62
1010-0099, Rev. 07