2 display settings, Toolbar commands, Display settings – Teledyne LeCroy FireInspector - Users Manual User Manual
Page 127
117
CATC F
IRE
I
NSPECTOR
2.01
C
HAPTER
9
User’s Manual
Reports
Step 4
Press Save.
Note: The visible portion of the bus utilization graph will be saved. If there is more than one graph open in
the Bus Utilization window, the visible portion of each graph will be saved in the file.
To e-mail a bus utilization graph:
Step 1
Click the E-mail
icon on the toolbar.
FireInspector makes the graph(s) into a bitmap file named Bus
utilization.bmp and attaches it to an e-mail message in the default e-mail
program. The message subject is filled in as “Bus utilization for Trace file
'source file name'.”
Step 2
Fill in message recipient information and send the message.
To print a bus utilization graph:
Step 1
Click the Print
icon on the toolbar.
The visible portion of the graph(s) will be printed. If there is more than one
graph open, the visible portion of each graph will printed on its own page.
9.5.2 Display Settings
Bus utilization graph display can be customized using the toolbar commands and the Graph
Area Menu.
Toolbar Commands
View Settings Menu
The Bus Utilization View Settings menu contains settings to configure the display of all
graphs within the display window. The view settings are associated with the active Trace
file, allowing you to create different settings for individual files.
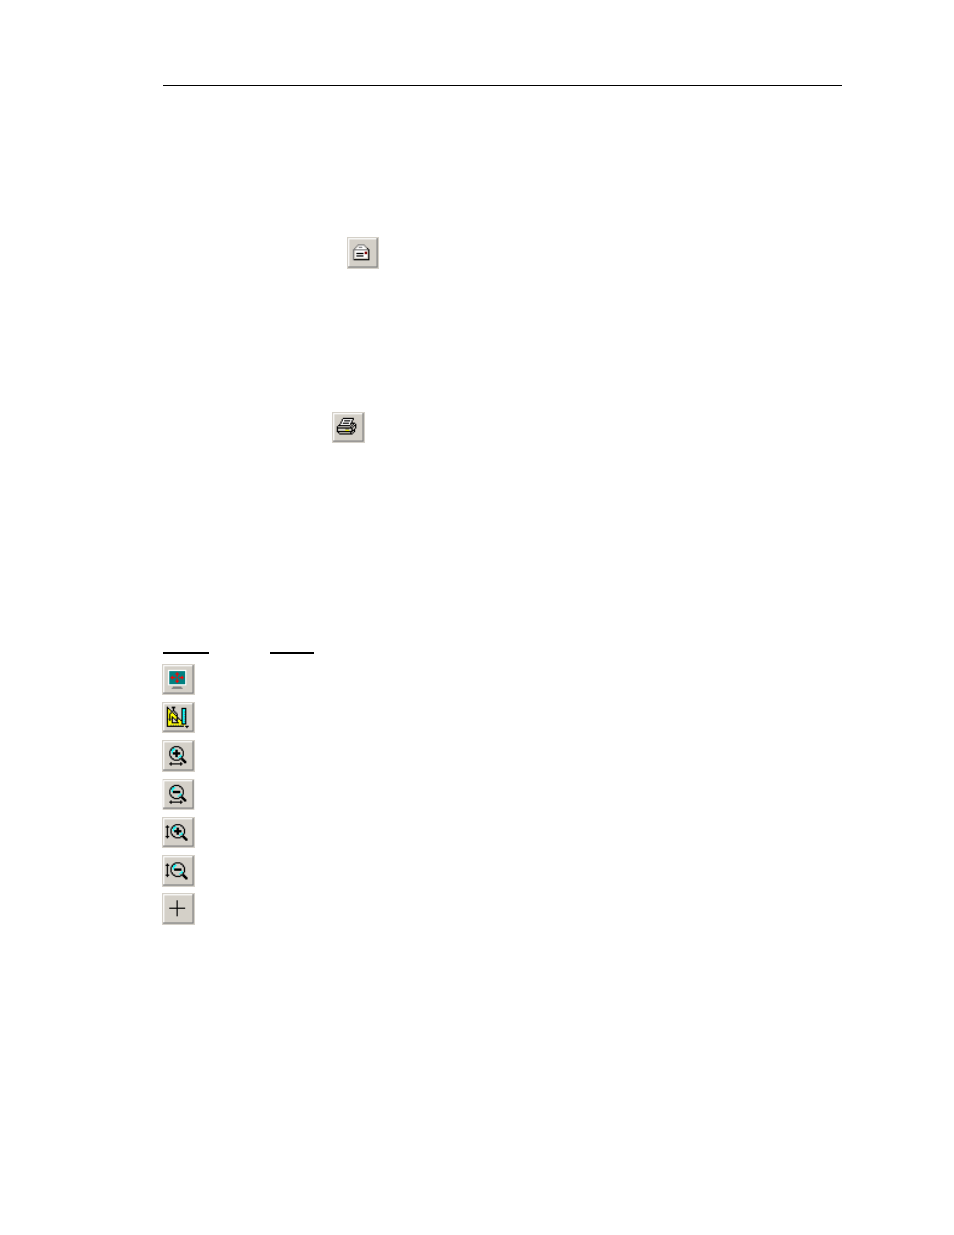
Button
Action
Maximizes or restores original size of the Bus Utilization window.
Opens the View Settings menu.
Zooms in the display horizontally.
Zooms out the display horizontally.
Zooms in the display vertically.
Zooms out the display vertically.
Zooms a selected vertical or horizontal portion of the display.