Teledyne LeCroy PeRT3 Phoenix System User Manual
Page 97
Teledyne LeCroy PeRT
3
Phoenix System User Manual
95
System Control Ribbon ‐‐ Analysis Tab
Teledyne LeCroy
Data Ch1-4
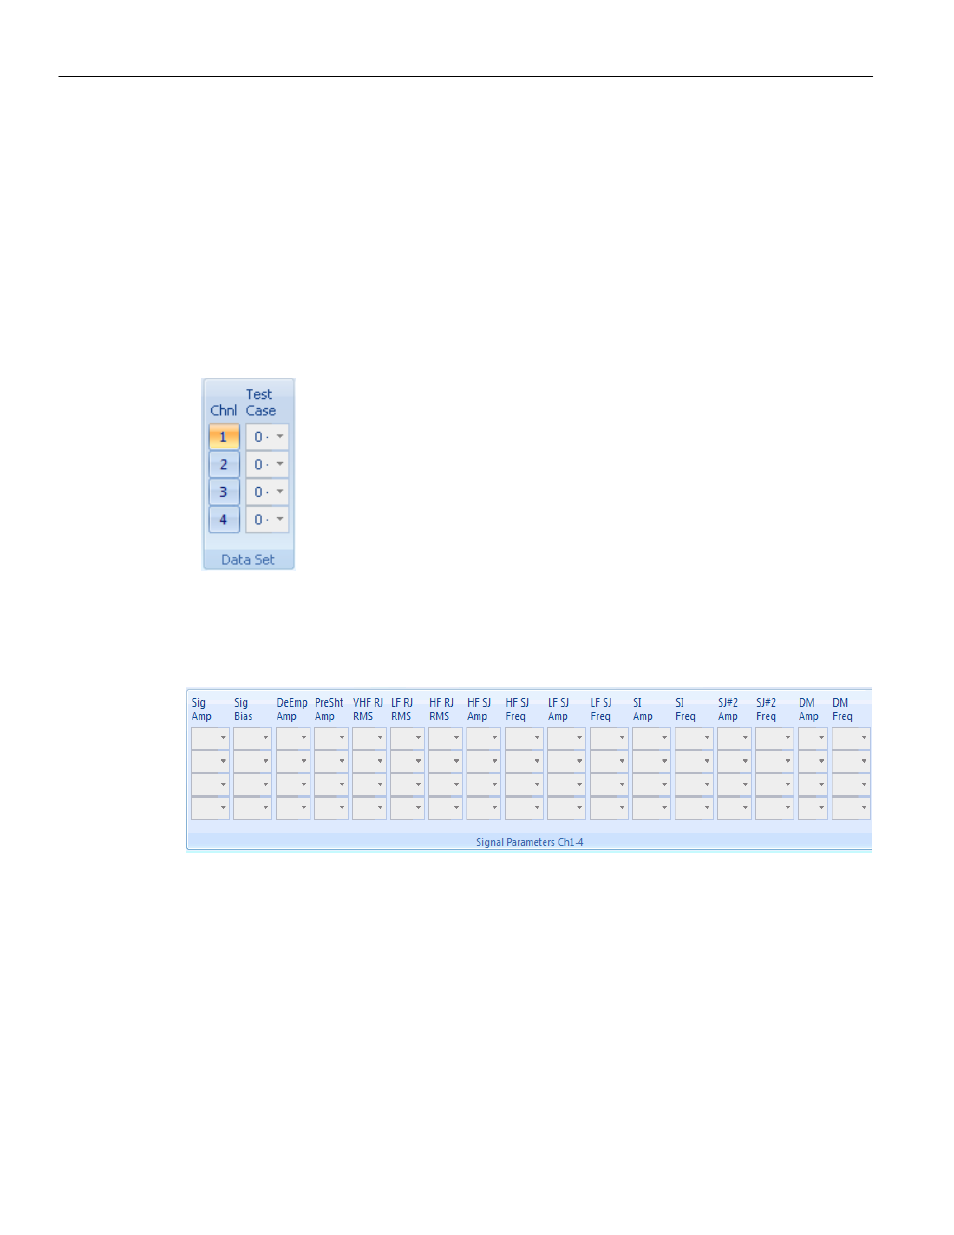
The Data Set panel allows the user to select between distinct sets of data.
For example, if a JTOL test was run twice while varying the frequency and amplitude of
sinusoidal jitter, once with SSC on and a second time with SSC off, this would form two
distinct sets of data within the same Test Report. The user would then be able to specify
which of the two data sets to graph using the drop‐down menu in the Test Case field for
the channel they want to graph.
The user can also specify which channel data to graph by clicking on the channel select
button in the Data Set panel (see figure below.)
Figure 10.5: Data Set Panel
Signal Parameters
Figure 10.6: Signal Parameters Panel
When the user selects a specific test case to graph, the Signal Parameters panel will
display the values of the signal parameters for the selected test case.
Depending on the data contained in the selected test case and how the data is being
graphed, the user may be able to further refine what is being graphed. For example, in
the case mentioned above of the two JTOL tests, if they are graphed as scatter graphs or
two‐parameter graphs, selecting the test case will completely specify the graph. However,
graphing the same test case as a single parameter graph, such as sinusoidal jitter
amplitude vs. BER, specifies a whole range of graphs (one for each sinusoidal jitter
frequency) which the user can select between by selecting a specific sinusoidal jitter
frequency in the Signal Parameters panel.