Histogram theory of operation, Dso process – Teledyne LeCroy WaveRunner XI SERIES Operator’s Manual User Manual
Page 96
W
AVE
R
UNNER
X
I
S
ERIES
96
WRXi-OM-E Rev C
T
understanding of statistical variations in parameter values is needed for many waveform parameter
measurements. Knowledge of the average, minimum, maximum, and standard deviation of the parameter may
often be enough, but in many cases you may need a more detailed understanding of the distribution of a
parameter's values.
Histograms allow you to see how a parameter's values are distributed over many measurements. They do this by
dividing a range of parameter values into sub-ranges called bins. A count of the number of parameter values
(events) that fall within ranges of the bin itself is maintained for each bin.
While such a value range can be infinite, for practical purposes it need only be defined as large enough to include
any realistically possible parameter value. For example, in measuring TTL high-voltage values a range of ±50 V is
unnecessarily large, whereas one of 4 V ±2.5 V is more reasonable. It is the 5 V range that is then subdivided into
bins. And if the number of bins used were 50, each would have a range of 5 V/50 bins or 0.1 V/bin. Events falling
e first bin
een 1.5 V and 1.6 V. While the next bin would capture all events between 1.6
and so on.
rovides a
d
sub-range
he 'Y' axis for the count of parameter values within each bin. The leftmost bin with a non-zero count
west parameter value measurements. The vertically highest bin shows the greatest number of events
lling within its sub-range.
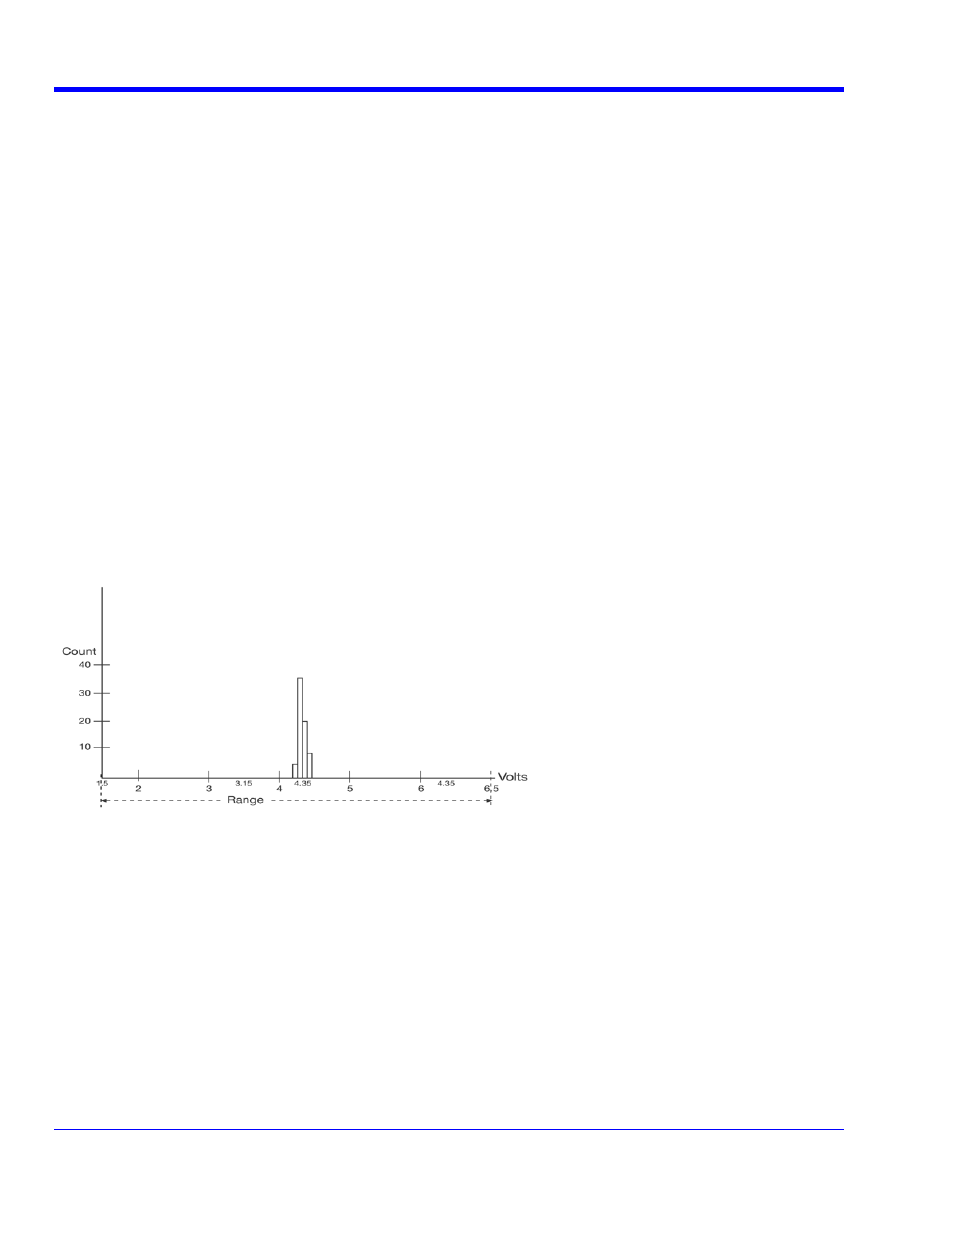
The number of events in a bin, peak or a histogram is referred to as its population. The following figure shows a
histogram's highest population bin as the one with a sub-range of 4.3 to 4.4 V (which is to be expected of a TTL
signal).
Histogram heory of Operation
An
into th
would then be betw
V and 1.7 V,
After a process of several thousand eve
good understan
nts, the bar graph of the count for each bin (its histogram) p
ing of the distribution of values. Histograms generally use the 'x' axis to show a bin's
value, and t
ws the lo
sho
fa
The lowest-value bin with events is that with a sub-range of 3.0 to 3.1 V. As TTL high voltages need to be greater
than 2.5 V, the lowest bin is within the allowable tolerance. However, because of its proximity to this tolerance and
the degree of the bin's separation from all other values, additional investigation may be required.
DSO Process
The instrument generates histograms of the parameter values of input waveforms. But first, you must define the
following:
• The parameter to be histogrammed
• The trace on which the histogram is to be displayed
• The maximum number of parameter measurement values to be used in creating the histogram
• The measurement range of the histogram
• The number of bins to be used