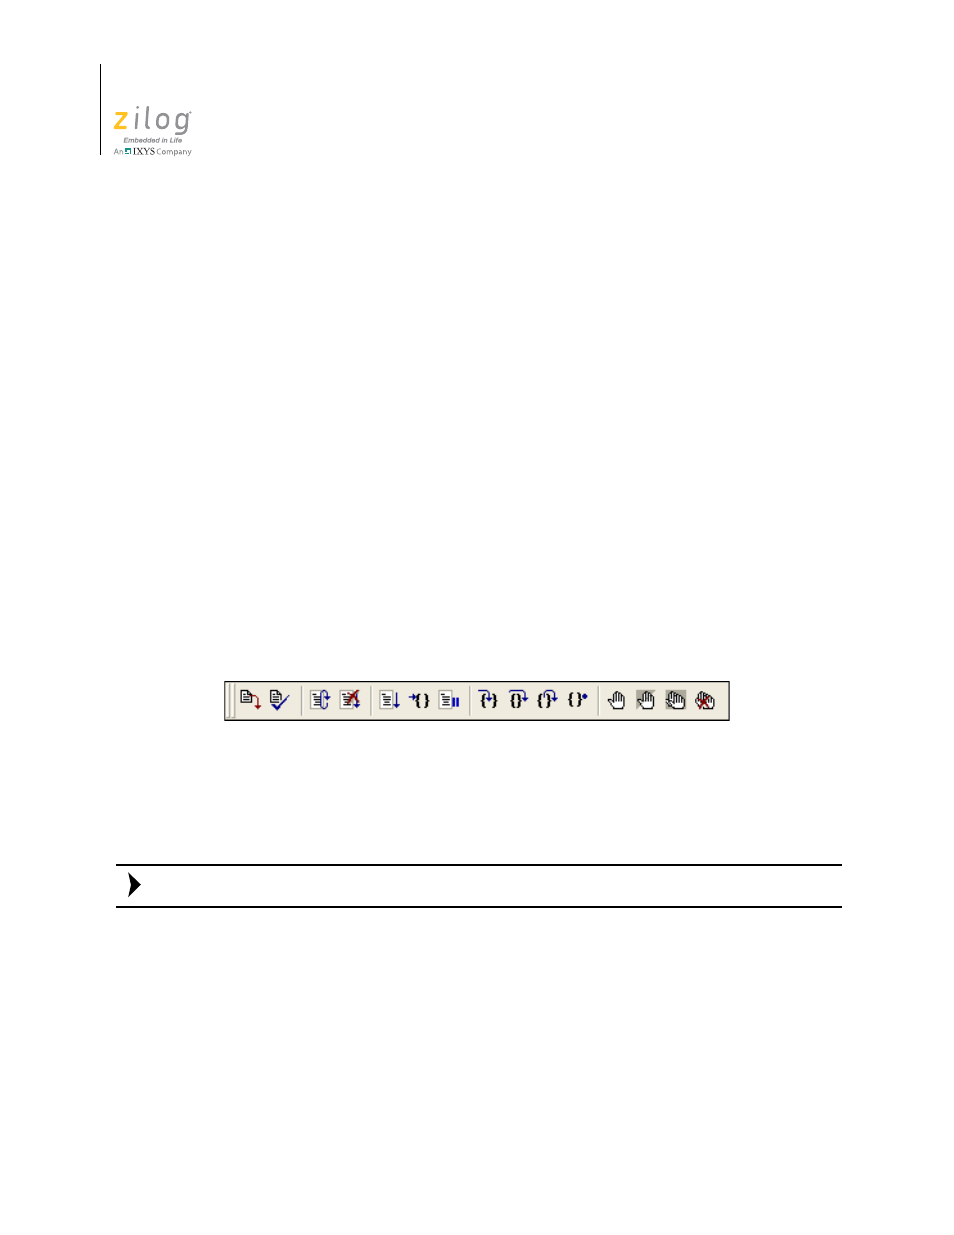
Debug toolbar, Figure 19. the debug toolbar – Zilog ZUSBOPTS User Manual
Page 48
Toolbars
UM017105-0511
20
Zilog Developer Studio II – ZNEO™
User Manual
Run Command Button.
Executes the command in the Command field. Output from the
execution of the command is displayed in the Command tab of the Output window.
Stop Command Button.
Stops any commands currently running.
Command Field.
The Command field allows you to enter a new command. Click the
Run
Command
button or press the
Enter
key to execute the command. Output from the execu-
tion of the command is displayed in the
Command
tab of the
Output
window.
To modify the width of the Command field, perform the following brief procedure:
1. Select
Customize
from the
Tools
menu.
2. Click to set your cursor in the
Command
field. A hatched rectangle highlights the
Command
field.
3. Use your mouse to select and drag the side of the hatched rectangle. The new size of
the
Command
field is saved as a new project setting.
Debug Toolbar
The Debug toolbar, shown in Figure 19, allows you to perform debugging functions with
the following buttons:
Download Code Button.
Downloads the executable file for the currently open project to
the target for debugging. The button also initializes the communication to the target hard-
ware if it has not been done yet. Use this button anytime during a debug session.
The current code on the target is overwritten.
Verify Download Button.
Determines download correctness by comparing executable
file contents to target memory.
Reset Button.
Resets the program counter to the beginning the program. If not in Debug
mode, a debug session is started. By default and if possible, clicking the
Reset
button
resets the program counter to symbol 'main'. If you deselect the
Reset to Symbol 'main'
(Where Applicable)
checkbox on the
Debugger
tab of the
Options
dialog box (see
page 102), the program counter resets to the first line of the program.
Figure 19. The Debug Toolbar
Note: