Chapter 8. using the debugger, N of using the debugger, Using the debugger – Zilog ZUSBOPTS User Manual
Page 355: Figure 137. debug and debug window toolbars
UM017105-0511
Using the Debugger
Zilog Developer Studio II – ZNEO™
User Manual
327
Chapter 8. Using the Debugger
The source-level debugger is a program that allows you to find problems in your code at
the C or assembly level. You can also write batch files to automate debugger tasks (for
details about the debugger, see the appendix titled
page 359). The following topics are covered in this section:
•
•
•
•
From the
Build
menu, select
Debug
, then select
Reset
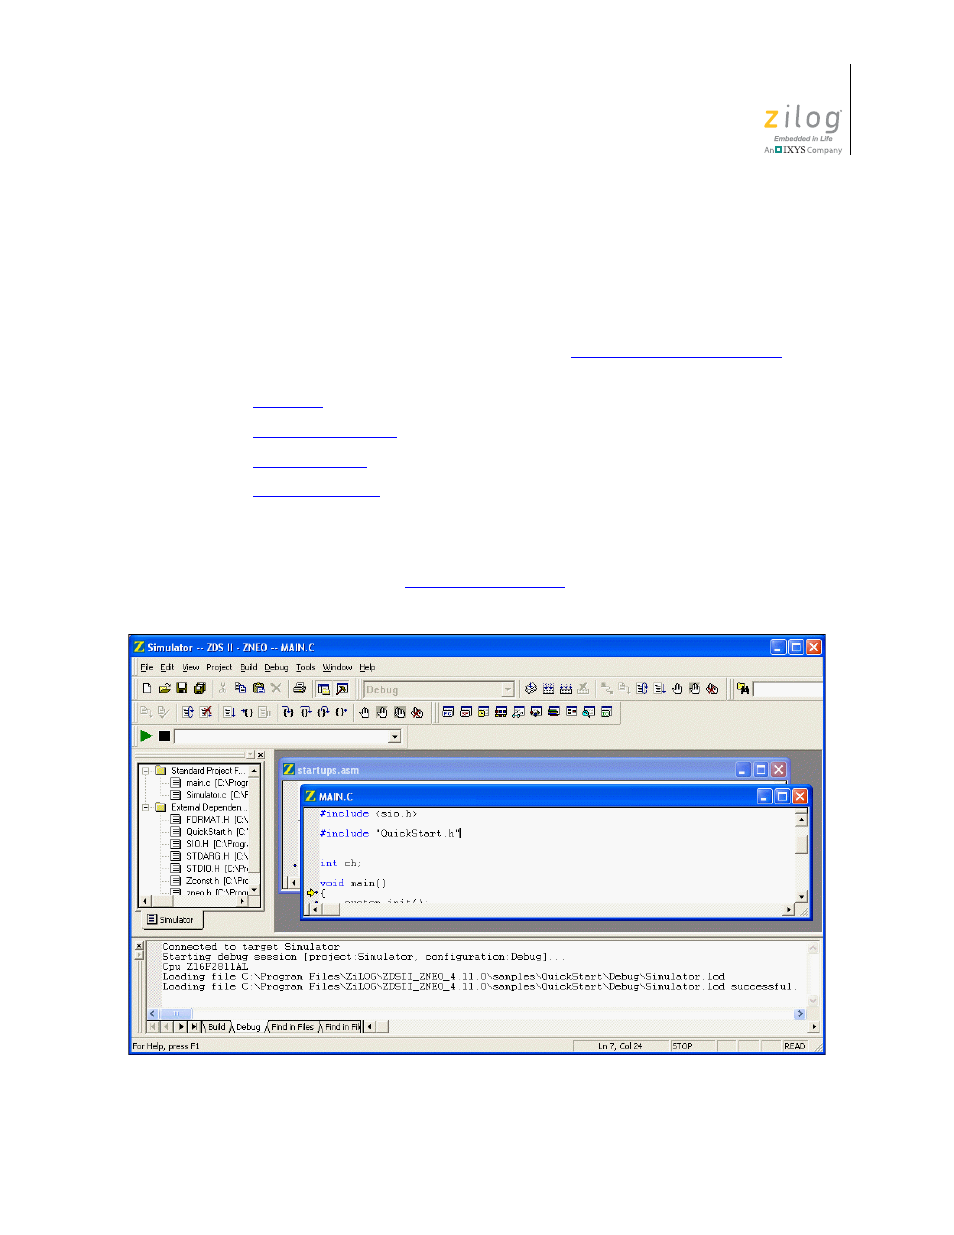
to transition to Debug Mode. The
Debug toolbar and Debug Windows toolbar are displayed, as shown in Figure 137. (For
more information, see the
Figure 137. Debug and Debug Window Toolbars