Adjust the oxycrg display and locate alarms – Welch Allyn Acuity and Mobile Acuity LT Central Monitoring Systems - User Manual User Manual
Page 118
114
Chapter 6 Review or print patient data
Welch Allyn Acuity Central Monitoring System
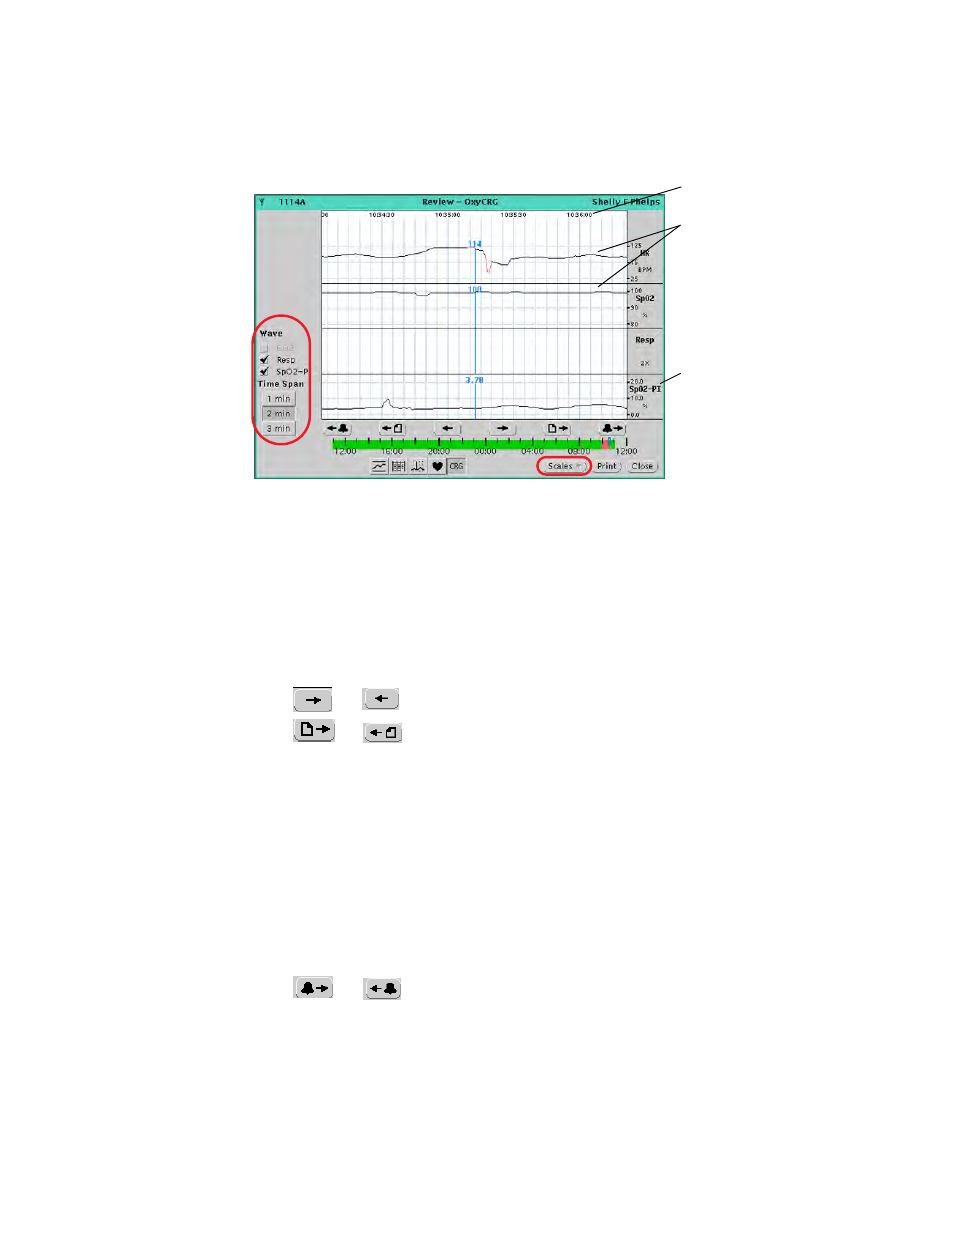
Adjust the OxyCRG display and locate alarms
.
To adjust the time period shown in the display area of the window
1.
Under Time Span, click a button.
Time markers show along the top of the graphs area.
2.
Click on the time line to display data from a different time period.
Along the time line, patient alarms are red.
3.
Scroll the display.
Click
or
to scroll the display forward or backward.
Click
or
to page the display forward or backward.
To select and adjust the CO
2
waveform and the trend graphs
1.
Under Wave, check up to three boxes to display the corresponding wave or trend
graphs.
2.
Click Scales, and then make a selection.
To locate and display alarm information
1.
Click a red (alarm) area along a trend graph or wave.
The blue cursor bar shows vital-sign values along each trend graph or wave.
2.
Click
or
to jump to the next or previous alarm.
HR and SpO
2
lines are
connected trend values.
Red lines indicate alarms.
Perfusion Index (PI). For
information, refer to
Masimo Corporation
literature.
Time marker
- GS 777 Wall Transformer - User Manual (1 page)
- 7114x Desk Charger - User Manual (8 pages)
- Mounting Bracket Replacement Kit for 7670-12 Mobile Stand with Mounting for 767XX and 777XX - User Manual (2 pages)
- 767 Diagnostic System - User Manual (16 pages)
- 767 Diagnostic System - User Manual (136 pages)
- 118 Series PanOptic Ophthalmoscope - User Manual (28 pages)
- 118 Series PanOptic Ophthalmoscope - User Manual (26 pages)
- VS100 Welch Allyn Vision Screener - User Manual (34 pages)
- SureSight Vision Screener - User Manual (36 pages)
- SureSight Vision Screener - User Manual (32 pages)
- Connex Integrated Wall System - User Manual (161 pages)
- SureSight Autorefractor - User Manual (36 pages)
- 12500 Binocular Indirect Ophthalmoscope Power Source - User Manual (12 pages)
- TM286 Auto Tymp - User Manual (72 pages)
- TM 262 Auto Tymp - User Manual (92 pages)
- MicroTymp 3 portable tympanometric instrument - User Manual (76 pages)
- Audioscope 3 Portable Screening Audiometer - User Manual (32 pages)
- AM282 Audiometer - User Manual (32 pages)
- AM 232 Manual Audiometer - User Manual (38 pages)
- Digital MacroView Otoscope - User Manual (32 pages)
- Digital MacroView Otoscope - User Manual (476 pages)
- OAE Hearing Screener - User Manual (56 pages)
- OAE Hearing Screener - User Manual (62 pages)
- OAE Data Manager - User Manual (39 pages)
- Ear Wash System 29350 - User Manual (28 pages)
- Standard laryngoscope blade assemblies - User Manual (6 pages)
- Standard laryngoscope handles - User Manual (6 pages)
- Rechargeable laryngoscope handles - User Manual (8 pages)
- Fiber optic laryngoscope handles - User Manual (7 pages)
- Fiber optic laryngoscope blade assemblies - User Manual (6 pages)
- Original Harvey and Harvey DLX Double and Triple Head Stethoscopes - User Manual (28 pages)
- Harvey Elite Stethoscope - User Manual (2 pages)
- Professional Stethoscope - User Manual (2 pages)
- EXPENDABLE ILLUMINATOR - User Manual (2 pages)
- KleenSpec Single Use Vaginal Speculum - User Manual (2 pages)
- KleenSpec Vaginal Specula Illumination System - User Manual (20 pages)
- KleenSpec 790 Series Cordless Illumination System - User Manual (32 pages)
- KleenSpec 790 Series Cordless Illumination System - User Manual (222 pages)
- Video Colposcope - User Manual (48 pages)
- Video Colposcope - User Manual (400 pages)
- Rigid Reusable & Single use Sigmoidoscopes, Anoscopes, Accessories - Cleaning, Disinfection, and Sterilization - User Manual (12 pages)
- 6V Power Supply, Rectal Light Handle - User Manual (240 pages)
- Fl-100 Intubating Fiberscope - User Manual (32 pages)
- EpiScope Skin Surface Microscope - User Manual (2 pages)
- 719 Series Lithium Ion Handle - User Manual (2 pages)