Welch Allyn Acuity and Mobile Acuity LT Central Monitoring Systems - User Manual User Manual
Page 104
100
Chapter 6 Review or print patient data
Welch Allyn Acuity Central Monitoring System
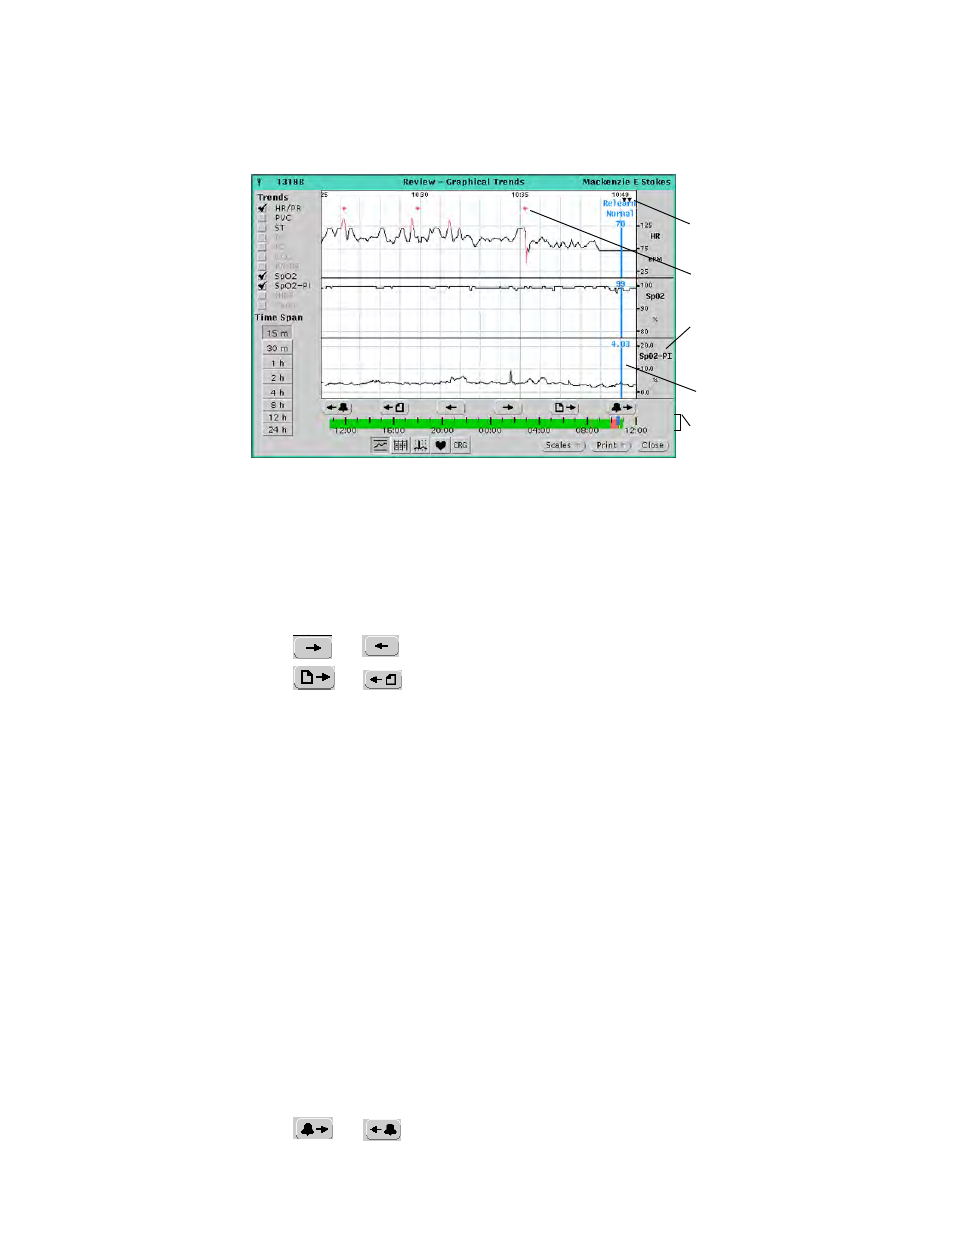
Adjust the graphical trends display and locate events
To adjust the time period shown in the graphs area of the window
1.
Under Time Span, click a button.
Time markers show along the top of the graphs area.
2.
Click on the time line to display data from a different time period.
Along the time line, patient alarms are red.
3.
Click
or
to scroll the display forward or backward.
Click
or
to page the display forward or backward.
To select and adjust the trend graphs
1.
Under Trends, check boxes to display associated trend graphs.
2.
Click Scales, and then make a selection.
To locate and display alarm and event information
1.
Click any of these things for details:
•
Click a red (alarm) area along a trend graph.
•
Along the top of the window, click an event marker.
▼ indicates Relearn, Learning Done or Snapshot Print events.
♥
indicates that an arrhythmia alarm was recorded.
♥
indicates that an arrhythmia event was detected, but no alarm occurred
because alarming for this arrhythmia type was turned off in the Arrhythmia
Alarms Setup window.
The blue cursor bar identifies event types and shows numeric values along each trend
graph.
2.
Click
or
to jump to the next or previous alarm.
▼
Event marker
♥
Arrhythmia event marker
Time line
SpO
2
Perfusion Index (PI).
For more information, refer
to Masimo Corporation
literature.
Cursor bar