Figure 80: pt100 in three-wire half-bridge – Campbell Scientific CR800 and CR850 Measurement and Control Systems User Manual
Page 266
Section 7. Installation
266
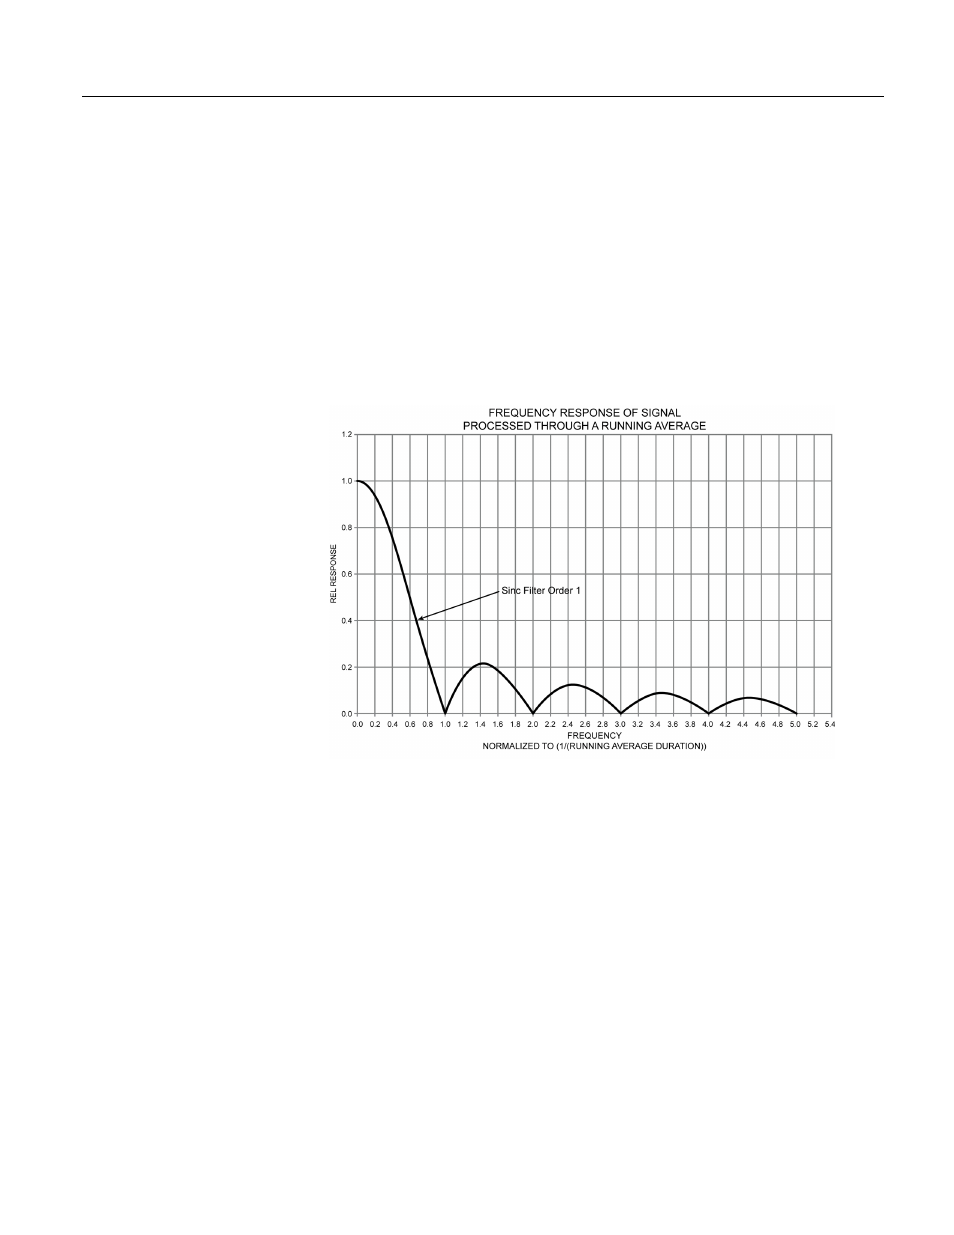
The recorded amplitude for this example should be about 1/3 of the
input‐signal amplitude. A program was written with two stored
variables: Accel2 and Accel2RA. The raw measurement was stored in
Accel2, while Accel2RA was the result of performing a running average
on the Accel2 variable. Both values were stored at a rate of 500 Hz.
Figure Running‐Average Signal Attenuation
(p. 267)
show the two values
plotted in a single graph to illustrate the attenuation (the running‐
average value has the lower amplitude).
The resultant delay (delay in time) = (Scan rate)(N‐1)/2 = 2 ms (10‐1)/2 =
9 ms. This is about 1/3 of the input‐signal period.
Figure 83: Running-average frequency response
See also other documents in the category Campbell Scientific Measuring instruments:
- 014A Met One Wind Speed Sensor (36 pages)
- 020C Wind Direction Sensor (26 pages)
- 024A-L Met One Wind Direction Sensor (30 pages)
- 03001-L R.M. Young Wind Sentry Set (34 pages)
- 03002, 03101, and 03301 R. M. Young Wind Sentry Sensors (40 pages)
- 034A-L WindSet (16 pages)
- 034B-L Met One Windset (34 pages)
- 036, 038 Spark Gapped Junction Box (6 pages)
- 05103, 05103-45, 05106, and 05305 R. M. Young Wind Monitors (30 pages)
- 083E Relative Humidity and Temperature Sensor (22 pages)
- 0871LH1 Freezing Rain Sensor (31 pages)
- 092 Barometric Pressure Sensor (24 pages)
- 10164-L Water Sampler Control Cable for use with Isco and Sigma Autosamplers (18 pages)
- 107-L Temperature Probe (28 pages)
- 108-LC Temperature Probe for MetData1 (12 pages)
- 108-L Temperature Probe (30 pages)
- 109-L Temperature Probe (30 pages)
- 109SS Temperature Probe (32 pages)
- 110PV Surface Temperature Probe (32 pages)
- 21108 RF450 Demo Kit (14 pages)
- 223-L Delmhorst Cylindrical Soil Moisture Block (28 pages)
- 227-L Delmhorst Cylindrical Soil Moisture Block (24 pages)
- 229 Water Matric Potential Sensor and CE4/CE8 (34 pages)
- 237-L Leaf Wetness Sensor (14 pages)
- 247-L Conductivity and Temperature (18 pages)
- 253-L and 257-L (Watermark 200) Soil Matric Potential Sensors (36 pages)
- 25458 DIN-Rail Terminal Kit (10 pages)
- 255-100 Novalynx Analog Output Evaporation Gauge (16 pages)
- 260-953 Alter-Type Wind Screen for Tipping Bucket Rain Gages (14 pages)
- 27106T Gill Propeller Anemometer (18 pages)
- 30066 Battery Terminal Bus (1 page)
- 380, 385, 380M, 385M Met One Rain Gages (22 pages)
- 3WHB10K 3-Wire Half-Bridge Terminal Input Module (14 pages)
- 43347 RTD Temperature Probe and 43502 Aspirated Radiation Shield (40 pages)
- 4386 Battery Terminal Bus (1 page)
- 4WFB120, 4WFB350, 4WFB1K 4-Wire Full Bridge Terminal Input Module (22 pages)
- 4WFBS120, 4WFBS350, 4WFBS1K 4 Wire Full Bridge Terminal Input Modules (46 pages)
- 4WPB100, 4WPB1K PRT Terminal Input Modules (16 pages)
- 52202 Electrically Heated Rain and Snow Gage (16 pages)
- 9522B Iridium Satellite Modem and COM9522B Interface Modem (46 pages)
- A100LK Anemometer (18 pages)
- A150 Desiccated Case (12 pages)
- A21REL-12 Relay Driver (10 pages)
- A6REL-12 Relay Driver (12 pages)
- AL200 ALERT2 Encoder, Modulator, and Sensor Interface (44 pages)