Total backend transfer report, Total backend transfer by hour of the day report, Percentage read hits – HP XP P9000 Performance Advisor Software User Manual
Page 418
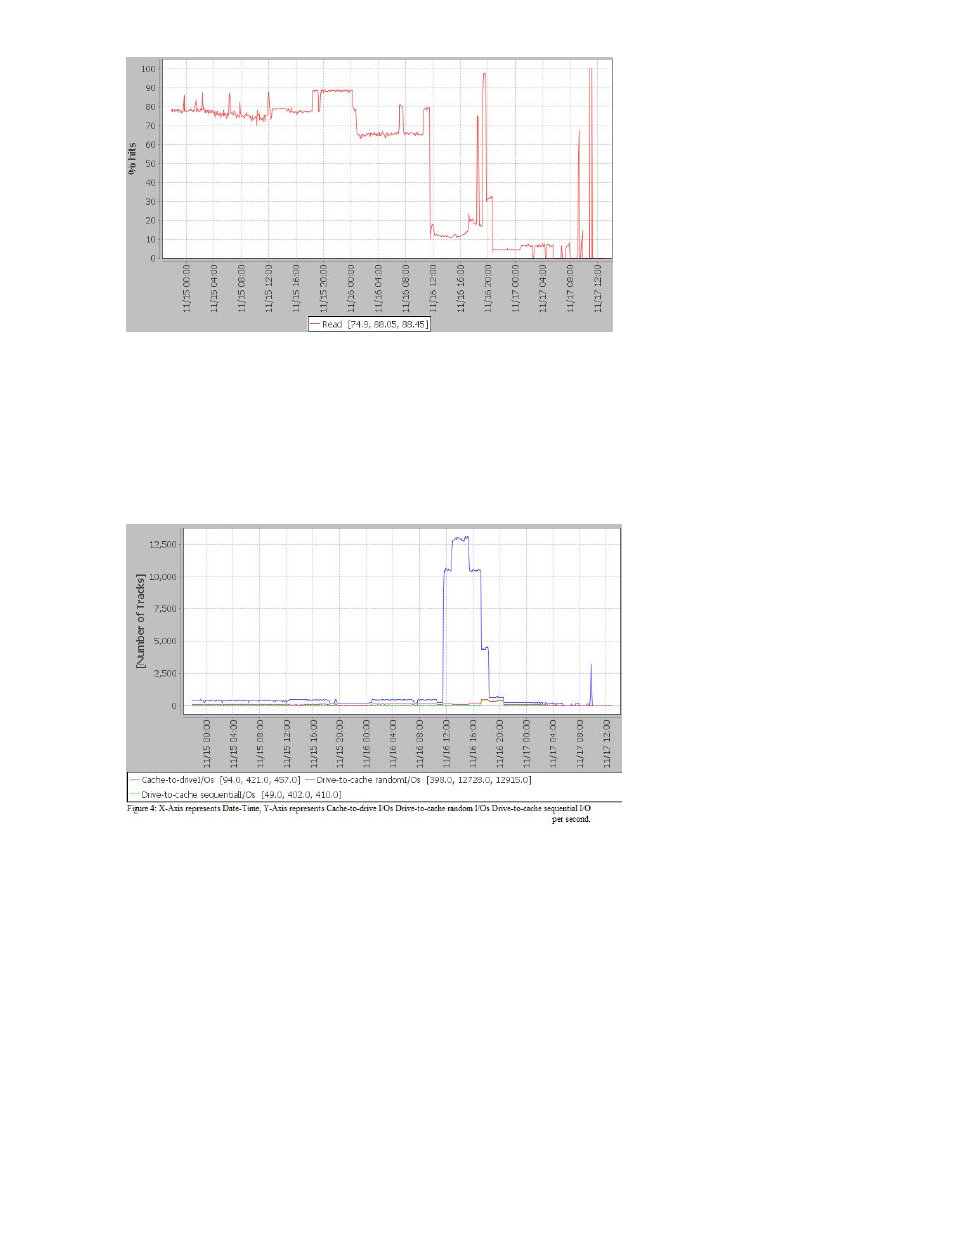
Figure 53 Percentage read hits
.
Total Backend Transfer report
The Total Backend Transfer report displays in a chart format, the total number of transfers, sequential,
random drive-to-cache, and cache-to-drive, per second.
” on page 418 displays a sample Total Backend Transfer report for a
P9500 Disk Array.
Figure 54 Total Backend Transfer report
.
Total Backend Transfer by Hour of the Day report
The Total Backend Transfer by Hour of the Day report displays in a chart format, the total number of
transfers, both sequential and random drive-to-cache transfers, and all cache-to-drive transfers, averaged
over a 24-hour period.
Total Backend Transfer by Hour of the Day
” on page 419 displays a sample Total Backend Transfer
by Hour of the Day report for a P9500 Disk Array.
Sample reports
418