HP XP P9000 Performance Advisor Software User Manual
Page 264
2.
Based on your requirement, select components from an XP or a P9000 disk array or choose
LDEVs from a custom group. You can also search for a particular physical LDEV in the component
selection tree, if you are aware of the LDEV name. For more information, see “
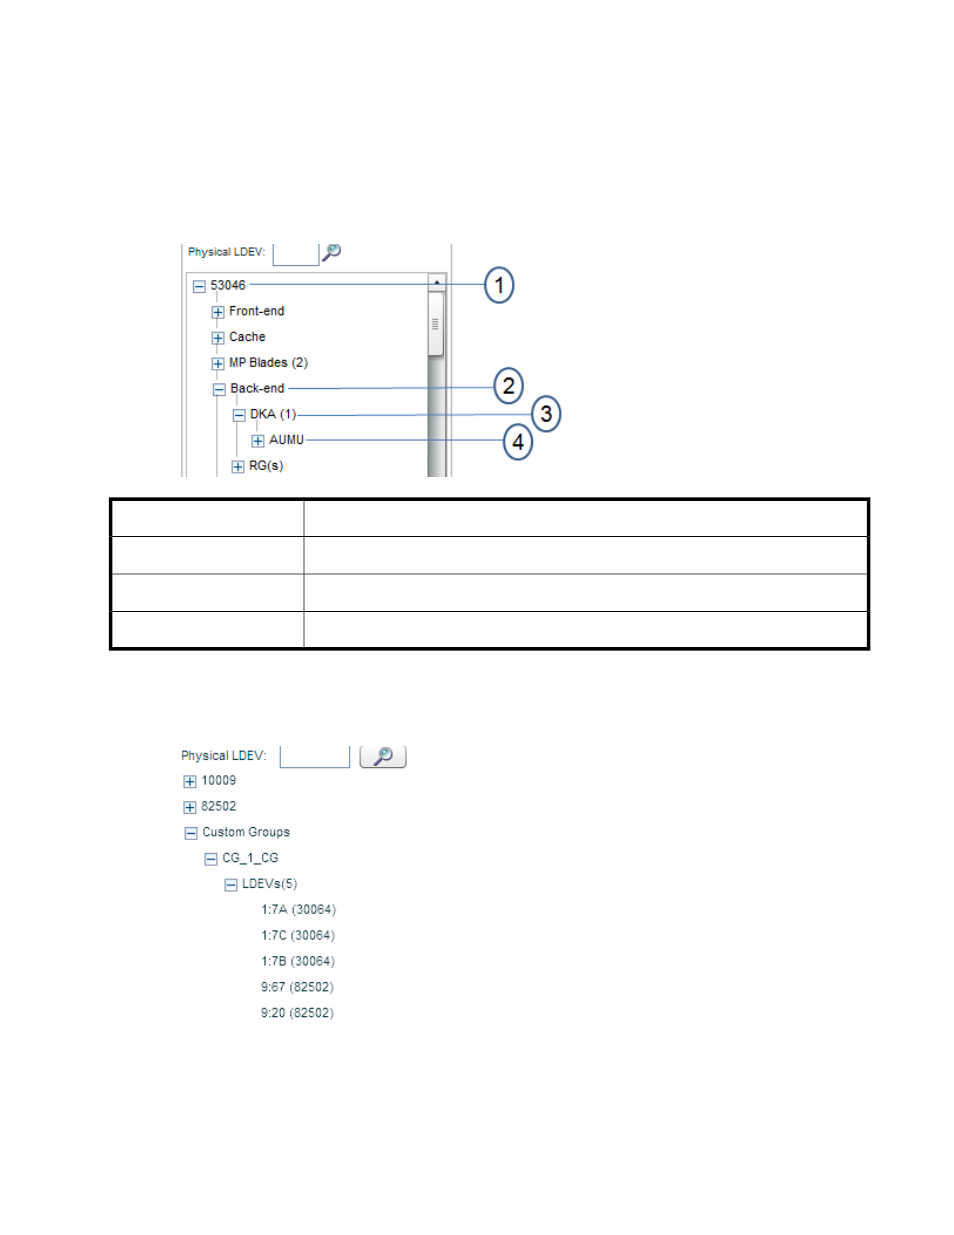
• Click the plus (+) sign for an XP or a P9000 disk array and select components from the list,
for which you want to view the performance graphs. The following image displays the hierarchy
for component selection.
For more information on selecting components, see “
Node
1
Main category
2
Component type
3
Component
4
• Click the plus (+) sign for Custom Groups and select an individual custom group from the list
followed by the associated LDEVs for which you want to view the performance graphs. The
DKC numbers of the XP and the P9000 disk arrays to which the LDEVs belong are also dis-
played in brackets beside the LDEV IDs.
Accordingly, the applicable metrics for the selected components are populated in the Available
Metrics Choose Metric Category list. The metrics are grouped under different metric categories.
Using charts
264