Realtime screen – HP XP P9000 Performance Advisor Software User Manual
Page 349

RealTime screen
The real-time performance data collection can be initiated on the RealTime screen, which appears
when you click Troubleshooting > RealTime in the left pane.
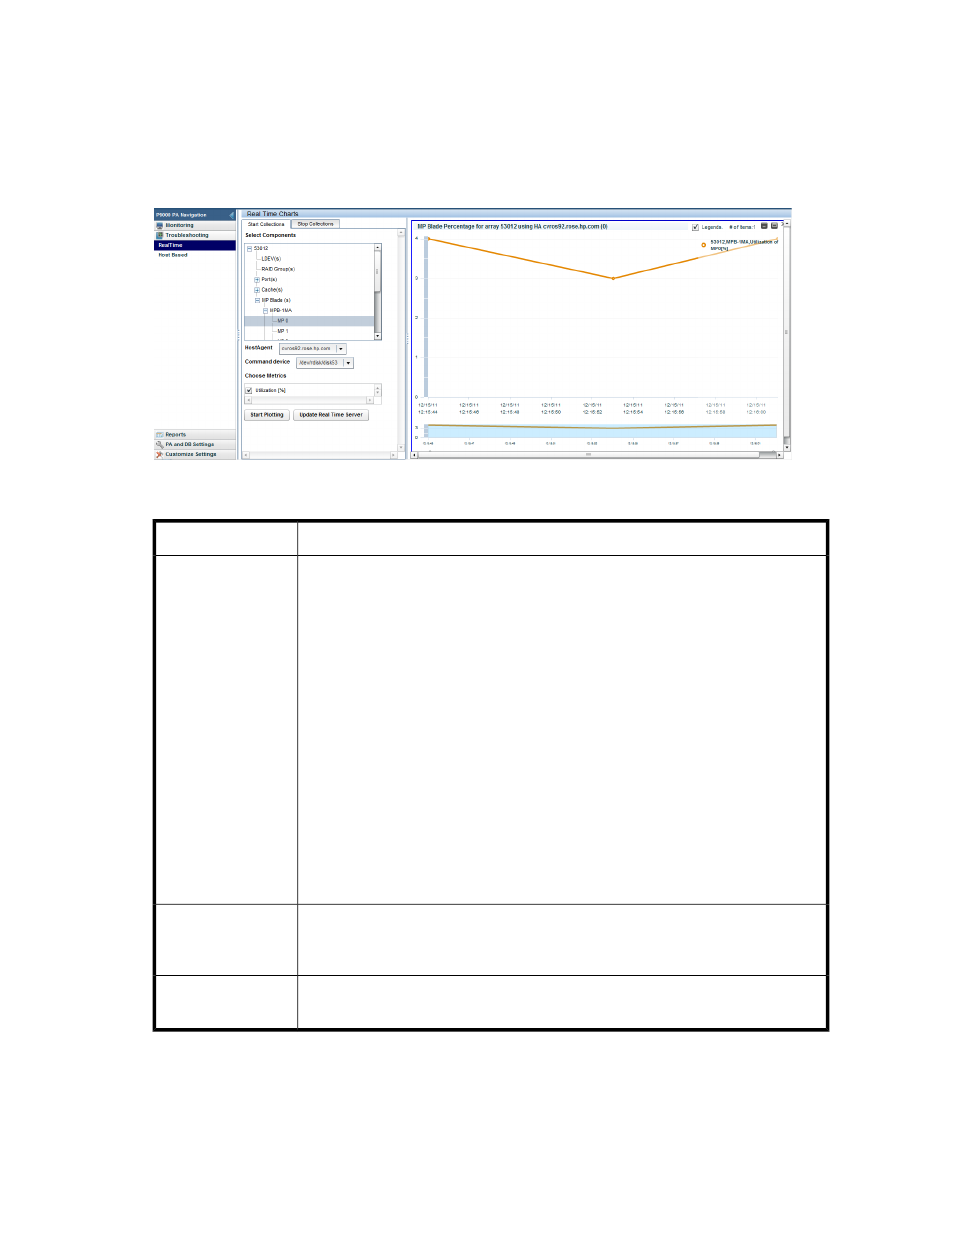
The following image shows the real-time charting components selection for 53012, which belongs to
the P9000 Disk Array type.
Figure 32 RealTime screen
.
Description
Screen elements
•
After the configuration data is collected for the XP or the P9000 disk arrays, they
are displayed for selection in the Select Components list, under Start Collections
tab.
•
The disk array components are displayed for each XP or P9000 disk array. The
following component categoriess are common for an XP and a P9000 disk array:
• LDEVs
• RAID Group(s)
• Port(s)
• Cache
Additionally, the CHA(s) and DKA(s) are displayed for an XP disk array, and the
MP Blade(s) are displayed for a P9000 disk array. Click a particular component
category to view the associated real-time metrics in the Choose Metrics list.
•
The associated host names are also populated in the HostAgent list. By default, the
first host in this list is associated with the first XP or P9000 disk array displayed in
the Select Components list.
You can select the XP or the P9000 disk array and related components for which you
want to collect the real-time performance data.
Start Collections tab
Displays the XP and the P9000 disk arrays for which real-time performance data
collection is in progress. You can stop a real-time data collection any time during the
collection process.
Stop Collections tab
P9000 Performance Advisor collects the real-time performance data for the selected
components and plots performance graphs in the Chart Work Area.
Chart Work Area and
chart options
Tasks you can perform on the RealTime screen
•
Starting real-time performance data collection
HP StorageWorks P9000 Performance Advisor Software User Guide
349
