Xp/p9000 array health – HP XP P9000 Performance Advisor Software User Manual
Page 126
XP/P9000 array health
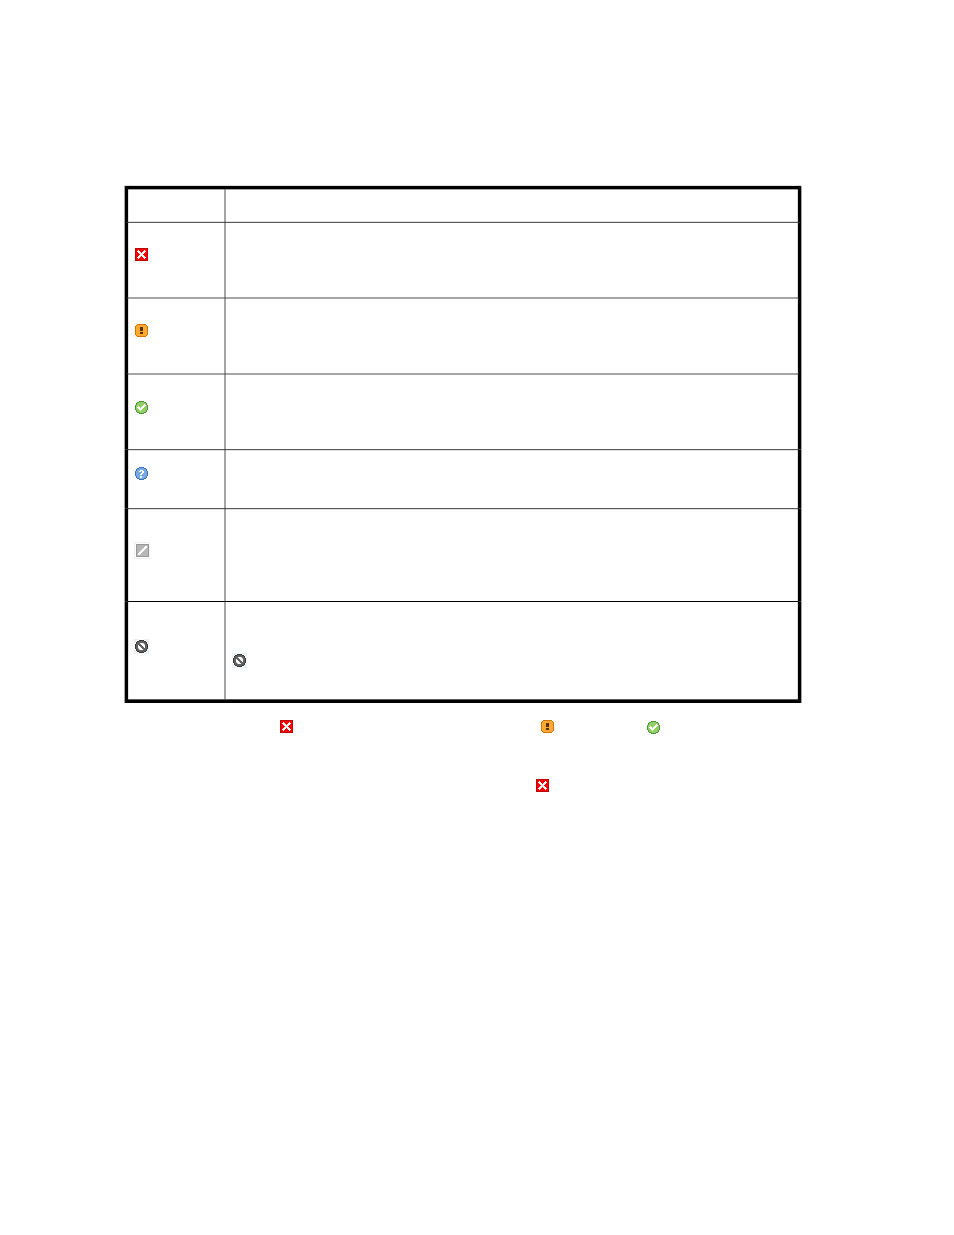
The following table describes the different status icons that depict the overall health of the XP and the
P9000 disk arrays in the Frontend, Cache, Backend, and the MP Blade (applicable for only the P9000
disk arrays) categories.
Description
Status icon
Critical.
Indicates that the usage of at least one component has crossed the set threshold limit during
the specified threshold duration.
Warning.
Indicates that the usage of at least one component is at 95% of the set threshold limit or higher
during the specified threshold duration.
Normal.
Indicates that the usage of all components is below 95% of the set threshold limit during the
specified threshold duration.
No Perf Data.
Indicates that the performance data is not collected during the specified threshold duration.
Disabled.
Indicates that the threshold settings are not yet configured for the metrics in the corresponding
categories. For more information on setting threshold limits, see “
Not applicable.
Indicates that the particular category is not applicable for the selected array.
appears in the MP Blade category for the XP disk arrays, as the MP blade related metrics
are applicable only for the P9000 disk arrays.
Further, the status icon
(Critical) takes precedence over the
(Major) and
(Normal) status
icons. For example, the Frontend statistics for a P9500 Disk Array shows that the usage of all
components is either at the normal level or almost reaching the defined threshold limits. However, the
overall usage status in the Frontend category still displays as
(Critical). It implies that there might
be one or more components in the Frontend category whose usage has crossed the defined threshold
limit for a particular metric during the specified threshold duration. Such components need your
immediate attention. For more information, see “
Monitoring performance of XP and P9000 disk arrays
126