HP XP P9000 Performance Advisor Software User Manual
Page 368
The additional set of metrics that P9000 Performance Advisor supports for the RAID groups, Ports,
and the CLPRs are as follows:
Table 27 Additional metrics for RAID groups, ports, and CLPRs
Description
Additional Frontend, Cache, and
Backend metrics
Resources
The total backend tracks loaded in
random mode for a specified RAID
group.
Non Seq Reads
RAID groups
The total backend tracks loaded in
sequential mode for a specified
RAID group.
Seq Reads
The total backend tracks destaged
for a specified RAID group.
Writes
The average I/Os on the port over
an entire collection interval.
Max IOPS
Ports
The maximum MB/s of data that
was read from or written to an LDEV
through the port.
Max MBPS
The total size of the CLPR shown in
MB/s.
Cache Size
CLPRs
the utilization of the sidefile shown
as a percentage value.
Side File Usage %
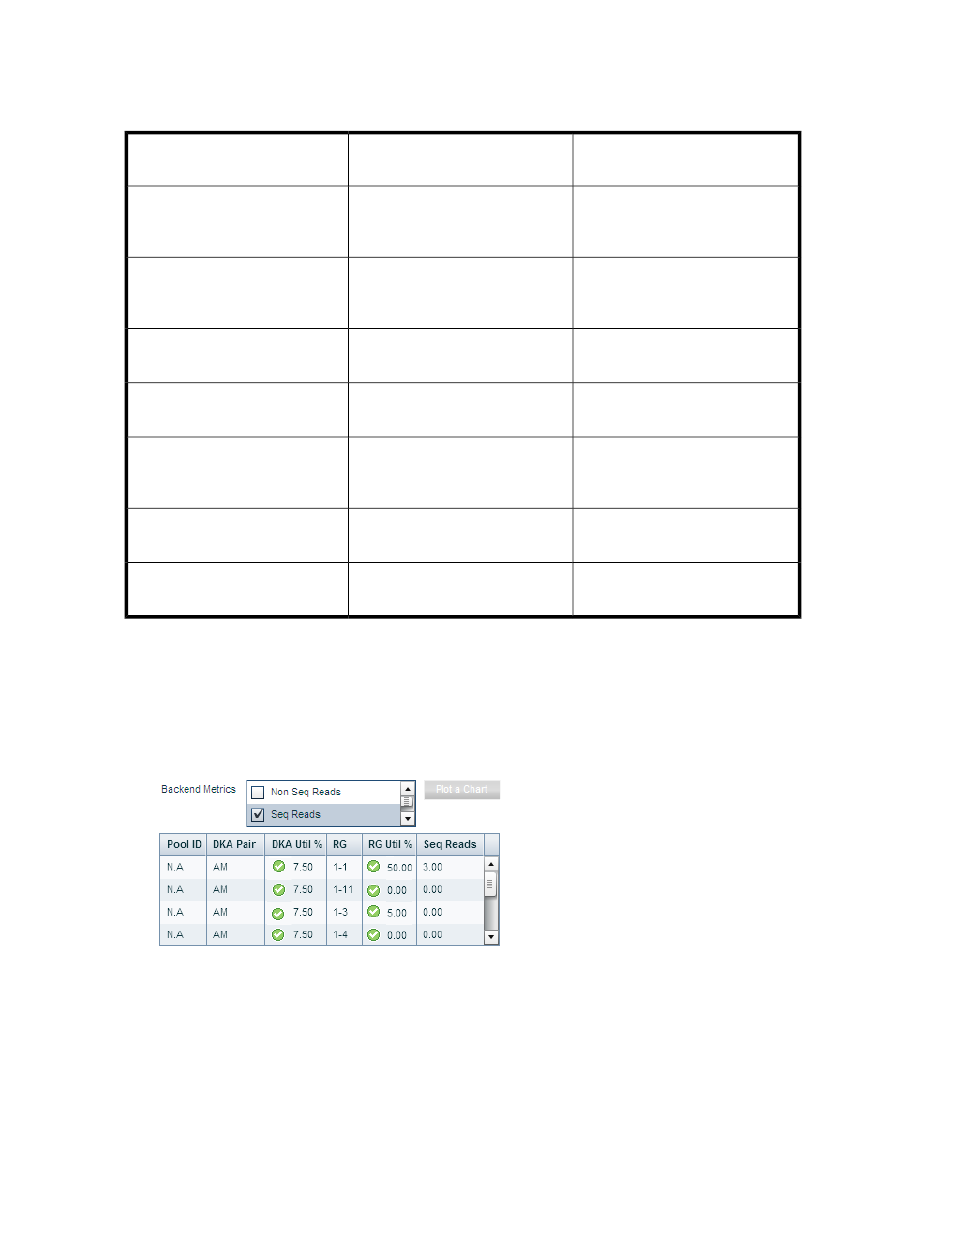
To view data for the additional set of metrics:
1.
Based on whether you want to view the additional data in the LDEV, Port, CLPR, or the RAID
Group table, navigate to the corresponding Metrics list.
2.
Select the check box for the metrics, for which you want to view the related component data.
A new column for the selected metric is added in the respective table and the component data
pertaining to the selected metric is displayed under that metric column.
In the above image, the Seq Reads metric is selected. The performance data of components
pertaining to Seq Reads is displayed in a separate column in the RAID Group table.
Troubleshooting issues for components associated with applications
368