Display id information, Sample on, Appdefinition.xml and appprofile.xml files – HP XP P9000 Performance Advisor Software User Manual
Page 393
The above image displays the LDEVs and ports associated with the host group san-ita1. The Chart
Work Area in the above image displays the maximum, minimum, and average I/O on the port
CL2D that is selected in the Array View - LDEV screen.
Sample on appDefinition.xml and appProfile.xml files
•
appDefinition.xml
file
•
appProfile.xml
file
In the appProfile.xml file, display_ID refers to the P9000 disk array components in P9000
Remote Web Console. The performance data in the form of historical and summary data is displayed
for the following components in P9000 Performance Advisor.
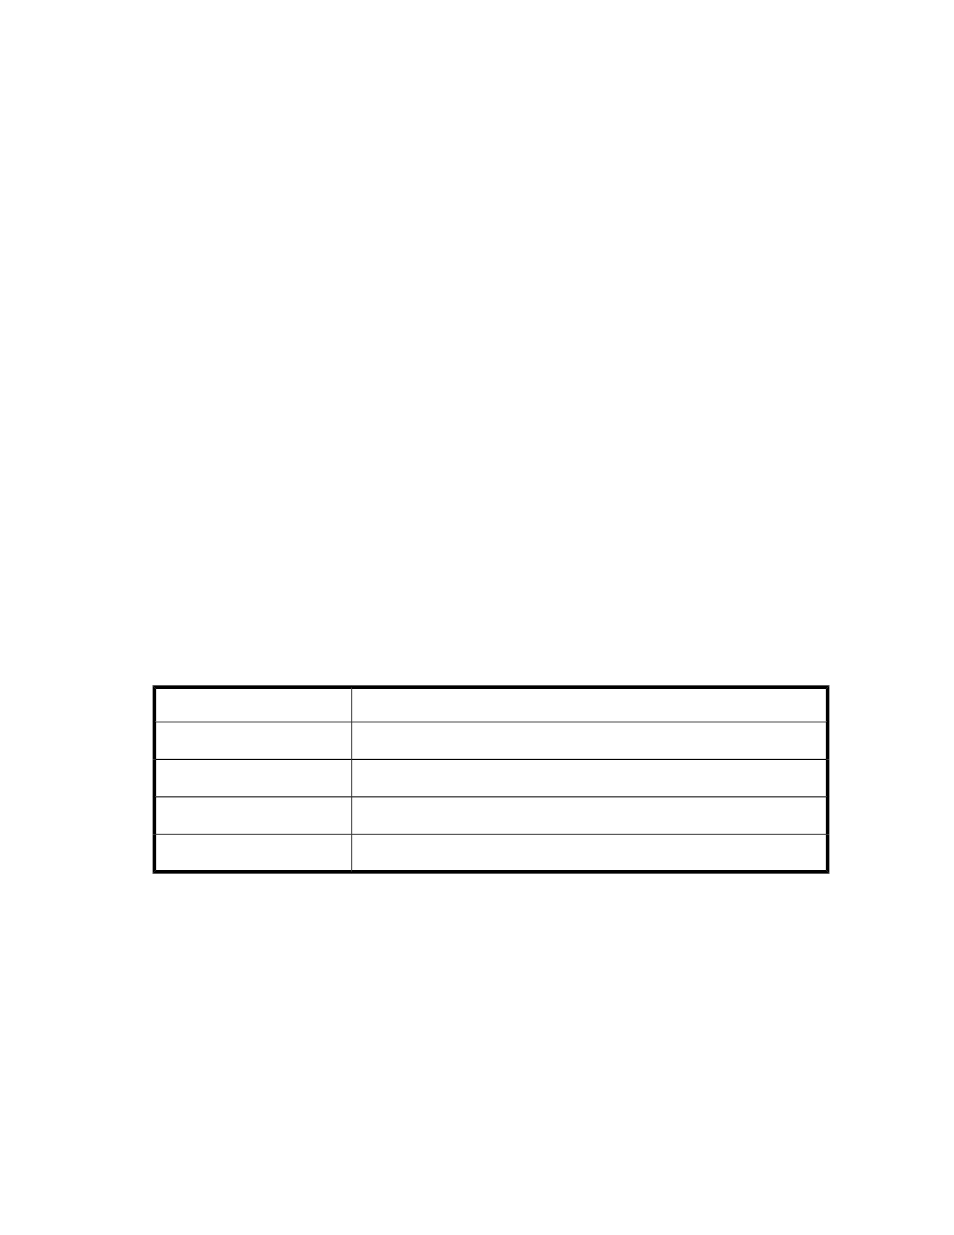
Table 28 Display ID information
Description
Display ID
View the performance data of MP blades.
V4-3
View the performance data of RAID groups.
V5-1
View the performance data of LDEVs.
V6-1
View the performance data of Ports/Host Groups.
V7-4
For more information on display_ID, read the following:
•
V4-3 enables you to view data related to MP blades in P9000 Performance Advisor. It is also
known as Processor Blades in P9000 Performance Advisor.
For example, if
the MP Blades application menu item does not appear for selection in the P9000 Remote Web
Console.
•
V5-1 enables you to view data related to RAID Groups in P9000 Performance Advisor. It is also
known as Parity Groups in P9000 Performance Advisor.
HP StorageWorks P9000 Performance Advisor Software User Guide
393