Ldev io report, Read/write detail, Ldev io reports – HP XP P9000 Performance Advisor Software User Manual
Page 410: Read/write, Detail

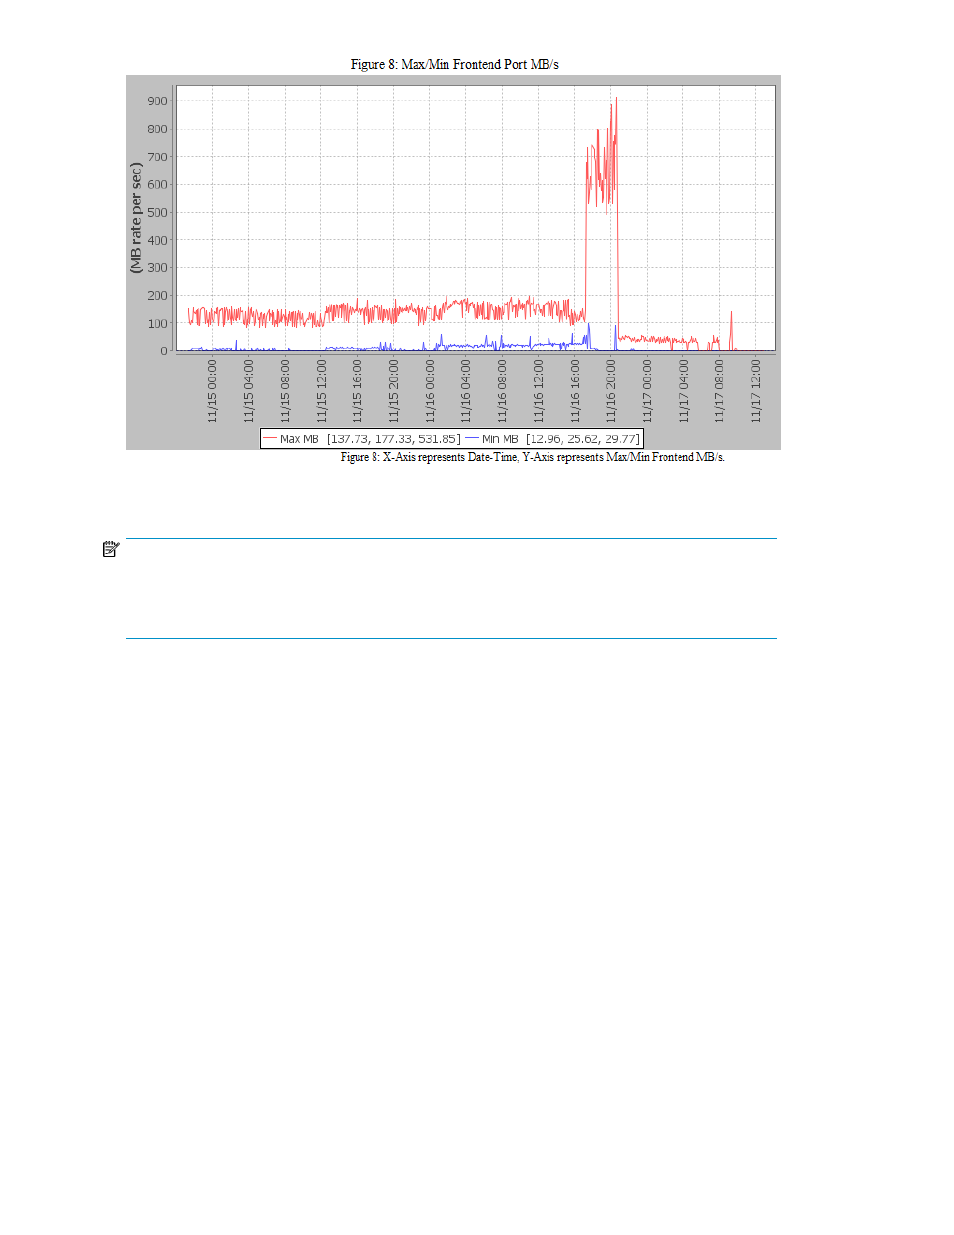
Figure 45 Read/Write Detail
.
NOTE:
If there are no data points available for the dates selected, blank chart is displayed. If all the data
values are zero for the dates selected, a chart with a horizontal line along X axis is displayed in the
center of the chart.
LDEV IO report
The LDEV IO report provides data on the busiest frontend and the backend LDEVs and RAID groups
on an XP or a P9000 disk array. It is based on the frontend I/Os and the backend transfers. You can
view the report for 8 - 128 busiest frontend and backend LDEVs, and 8 - 32 busiest frontend and
backend RAID groups. The selection is in multiples of eight.
If you do not select any value from the respective drop-down lists, by default, the LDEV IO report is
generated for the eight busiest frontend and eight backend LDEVs, and eight frontend and eight
backend RAID groups. Further, the report displays the graphs for only those LDEVs that have the
associated I/Os and those RAID groups on which the I/Os transactions have occurred.
Consider the following example: A report is created to view 32 busiest frontend LDEVs and 16 busiest
frontend RAID groups, and only eight of the selected 32 LDEVs and four of the selected 16 RAID
groups are busy. P9000 Performance Advisor generates the LDEV IO report where you can view the
graphs for only the eight LDEVs and four RAID groups on which the maximum I/O transactions have
occurred. The graphs are not shown for the remaining LDEVs or the RAID groups. The LDEV IO report
also provides a link to the additional LDEV IO mapping information. The busiest LDEVs are displayed
at different ranks in a tabular format.
Sample reports
410
