Nlaboratory analysis results window, Lwindow layout, Lcontents of information – Yokogawa GC1000 Mark II Process Gas Chromatograph User Manual
Page 83
<6. Analysis Results Windows>
6-8
IM 11B03G03-03E
n
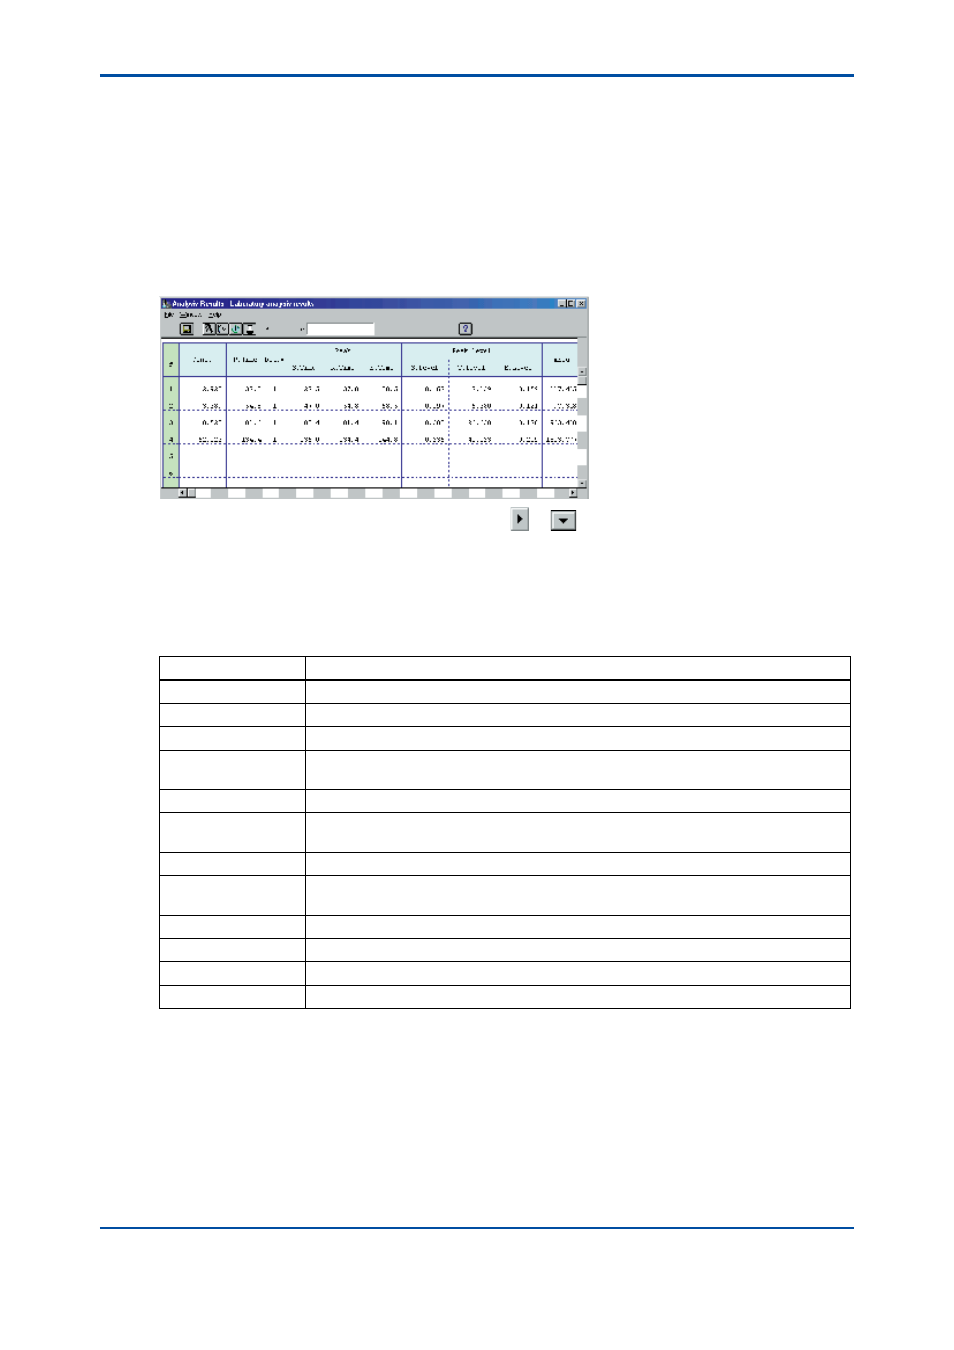
Laboratory Analysis Results Window
The Laboratory Analysis Results window displays the most recent results of laboratory analysis
done by the analyzer in the Lab mode in the order that peaks are detected. The results of a
laboratory analysis are updated each time the analyzer completes a laboratory analysis. To
record the current data for future reference, save this window. To view the data not shown on the
initial screen, use the scroll bar.
l
Window Layout
The following figure shows the layout of the Laboratory Analysis Results window.
F0608.ai
To view the unseen parts of the data, click on the or
buttons on the horizontal or
vertical scroll bar to scroll the page.
l
Contents of Information
The following table summarizes the contents of the data items shown in the Laboratory Analysis
Results window.
Item
Description
Analysis start time
Indicates the date and time when analysis of the on-screen data started.
#
Indicates the number (1 to 255) of peaks (that have been detected).
Concentration
Indicates the concentration (in percent) for each peak.
Retention time
Indicates the retention time (in seconds) for each peak.Indicates the detector number
(1 or 2) for each peak.
Det. #
Indicates the starting time/retention time/ending time (in seconds) for each peak.
Peak-peak start/
retention/peak end
Indicates the state of tracking for each peak as Baseline, Tracking or None.
Tracking
Indicates the starting level/top level/ending level (mV) for each peak.
Peak level start/
height/end
Indicates the integrated value (mV-sec) of level for each peak.
Area
Indicates the state of data processing for each peak using a two-character code.
Shape
Indicates “p” if it is a tangent correction, or “H” if it is a vertical separation.
Half width
Indicates the half width (in seconds) for each peak.
Tailing constant
Indicates the tailing constant for each peak
4th Edition : Mar. 21, 2012-00