Ndata display area, Larea layout, Ldescriptions of the area – Yokogawa GC1000 Mark II Process Gas Chromatograph User Manual
Page 37
<3. Analyzer Operation Window>
3-8
IM 11B03G03-03E
l
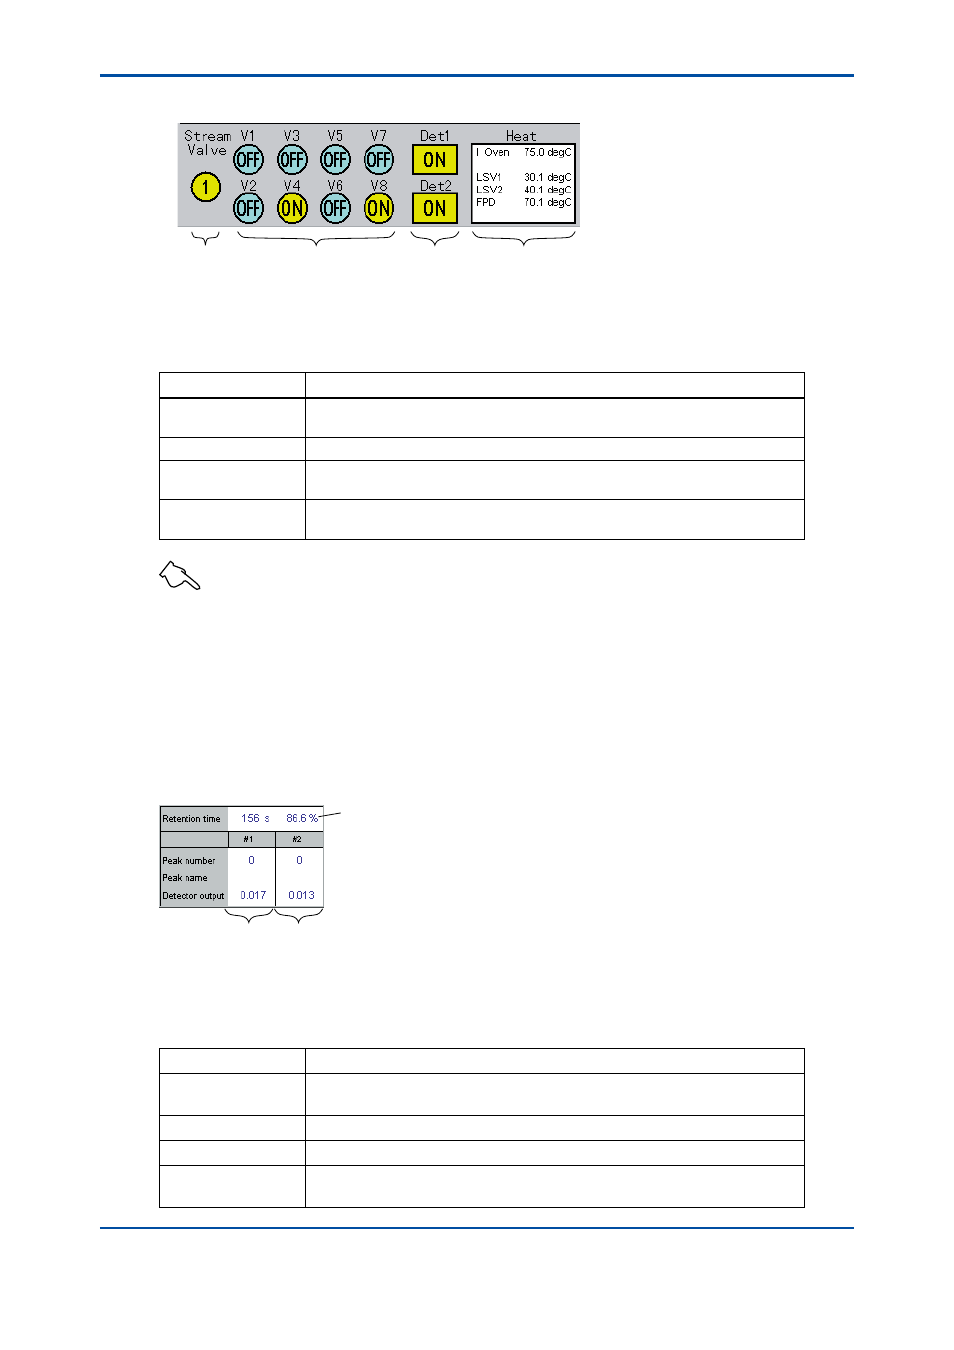
Area Layout
F0310.ai
Stream valve
status
Valve status
Detector
status
Temperature controller
status
l
Descriptions of the Area
The following table summarizes the descriptions of the display.
Item
Available Information
Stream Valve
Indicates the state of each stream switching valve. If all of the valves are turned
off, the area simply appears gray.
Valves 1 to 8
Indicate the on/off state of the valves 1 to 8 each.
Det 1/Det 2
Indicates the on/off state of the detector. Clicking the right mouse button on this
symbol opens the detector signal window.
Heat
Indicates the state of the temperature controller. Clicking the left mouse button
on this symbol opens the Temperature Control Unit Operation window.
See Also
For information on the detailed display of the detector signal and temperature controller, see Section 3.3.
n
Data Display Area
This area displays the retention time, peak number, peak name, and detector signal. The data is
updated in one-second cycle. If two detectors are used, this area shows data separately for each
detector.
l
Area Layout
Common data area
F0311.ai
Detector 1
data
Detector 2
data
l
Descriptions of the Area
The following table summarizes the descriptions of the display.
Item
Available Information
Retention time
Indicates the time elapsed since the start of analysis. Also indicates the ratio of
the elapsed time to the analysis period in a percentage.
Peak number
Indicates the number of the peak being analyzed.
Peak name
Indicates the ID of the peak being analyzed.
Detector output
Indicates the level of the detector signal in millivolts [mV]. The chromatogram in
the chromatogram display area represents the pattern of this signal.
4th Edition : Mar. 21, 2012-00