Nconcentration analysis history window, Lwindow layout, Lcontents of information – Yokogawa GC1000 Mark II Process Gas Chromatograph User Manual
Page 81
<6. Analysis Results Windows>
6-6
IM 11B03G03-03E
n
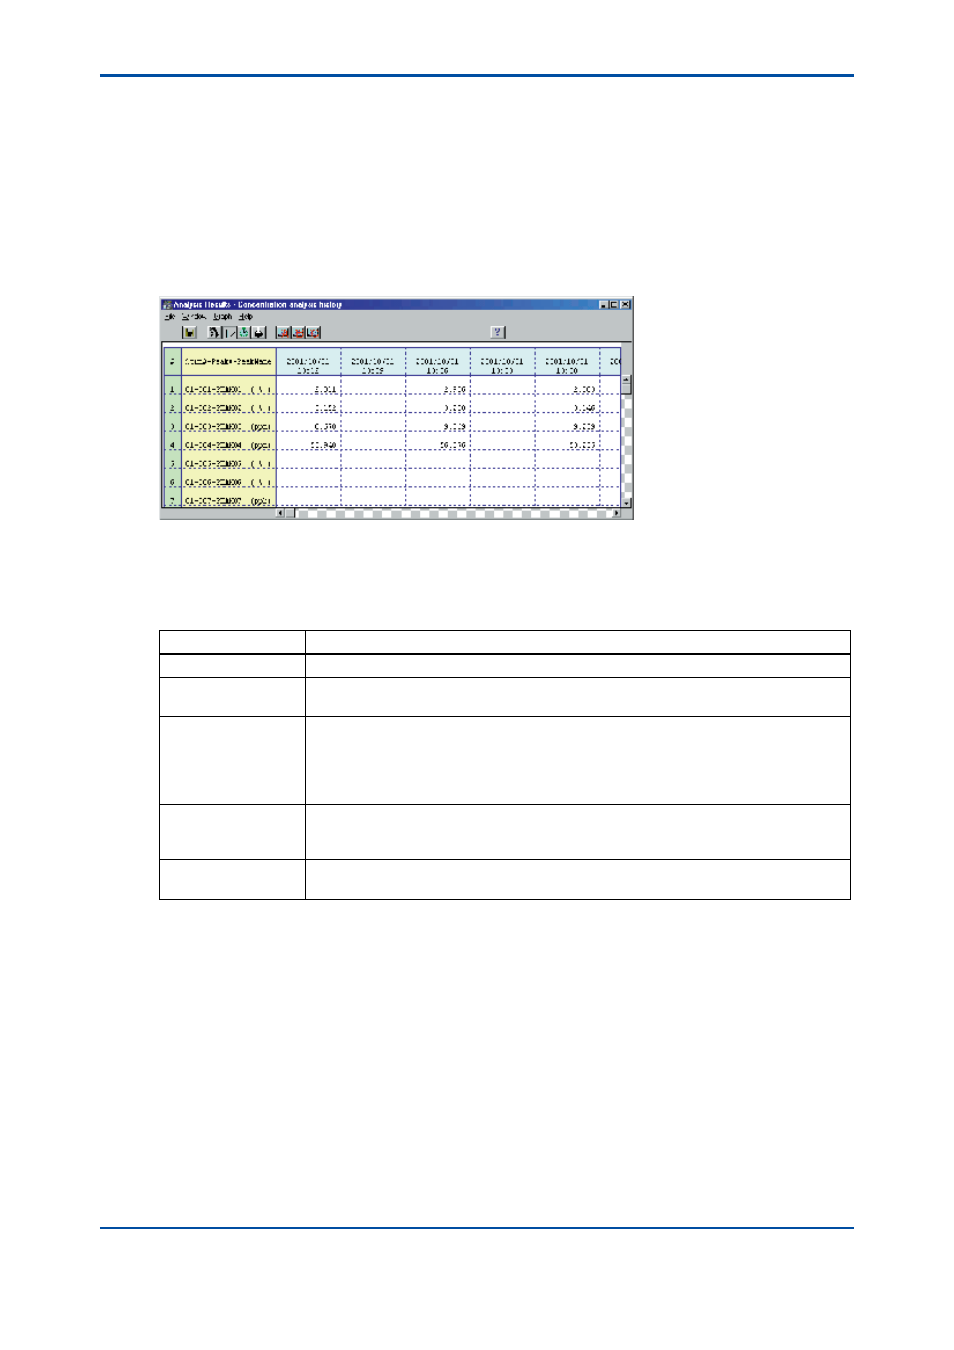
Concentration Analysis History Window
The Concentration Analysis History window is used to view the trend of the concentration data
which the analyzer has analyzed to date in the Process mode. This window shows all the peaks
assigned at the startup of the Analysis Results window. The Concentration fields of peaks not
measured at the given time remain blank. To view the data not shown on the initial screen, use
the scroll bar.
l
Window Layout
The following figure shows the layout of the Concentration Analysis History window.
F0606.ai
l
Contents of Information
The following table summarizes the contents of the data items shown in the Concentration
Analysis History window.
Item
Description
Analysis start time
Indicates the date and time when analysis of the on-screen data started.
#
Indicates the relative number (1 to 255) of peaks (the serial number of all peaks of all
streams).
Stream# - Peak#
- Peak name
Indicates the peaks of the stream, in ascending order (in the order of their assignment)
of the peak number, in which the latest analysis has been executed.
The system uses dashes “-” to connect the stream number, peak number and
peak name in sequence, followed by the concentration unit (%, ppm or no unit) in
parentheses.
Date/time
Indicates the date (year/month/day) and time (hour/minute) when the analysis for each
cycle started (up to 250 date/time data items). If the number of data items exceeds
250, the oldest data item is discarded to make way for a new data item.
Concentration
Indicates the concentration for each peak (the unit of concentration immediately
follows the peak name).
4th Edition : Mar. 21, 2012-00