Luminex 100 IS Version 2.2 User Manual
Page 34
Luminex
100
IS Developer Guide to
x
MAP Technology Version 2.2
x
MAP
Technology
28
PN 89-00002-00-032 Rev. A
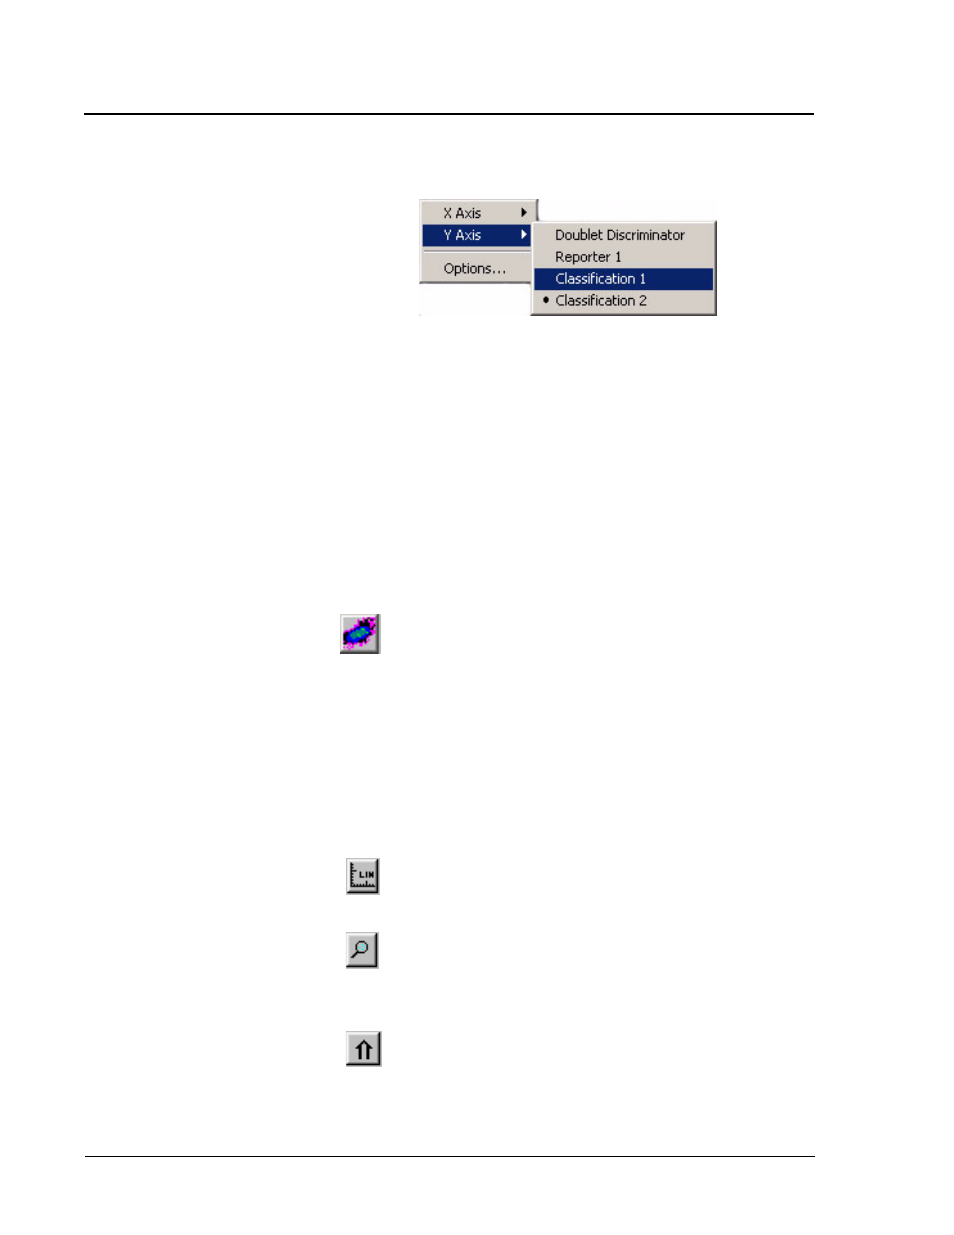
Figure 17. Dot Plot Pull-Down Menu
2. Select the Y Axis entry, then select the desired value from the
list.
To change the X axis category:
1. Right-click anywhere in the Dot Plot to display the pull-down
menu.
2. Select the X Axis entry, then select the desired value from the
list.
Dot Plot Buttons
Use the four buttons at the top of the frame to control the display:
Density/Decaying.
Use this button to toggle between the
default Density Dot Plot and the Decaying Dot Plot.
The Decaying Dot Plot feature only plots the 100 most
recent events acquired by the analyzer.
The Density Dot Plot displays a constant accumulations of events.
Increasing density is indicated by contrasting colors. See Table 7.
To change the Density Dot Plot options refer to the Dot Plot Buttons
section in the Luminex 100 IS User Manual Version 2.2.
Log/linear.
Use this button to toggle the X axis and Y axis
scale between logarithmic and linear modes. This button is
only active when viewing Dot Plot.
Zoom.
The zoom function enlarges a specific area on the
display. Use the scroll bar to move across the graph. Left-
click and drag right to left in the Dot Plot to navigate around
the Dot Plot.
Maximize/minimize.
Use this button to enlarge the entire
Dot Plot frame, or return it to its smaller size.