Dot plot – Luminex 100 IS Version 2.2 User Manual
Page 32
Luminex
100
IS Developer Guide to
x
MAP Technology Version 2.2
x
MAP
Technology
26
PN 89-00002-00-032 Rev. A
Histogram Buttons
and Field
There are four buttons and the Show Bead field at the top of the
histogram:
Show Bead.
Select an entry from the drop-down list to define how
you want to display events. You can define: only one bead set [bead
set number],
Note:
The calculated data uses only
the final result.
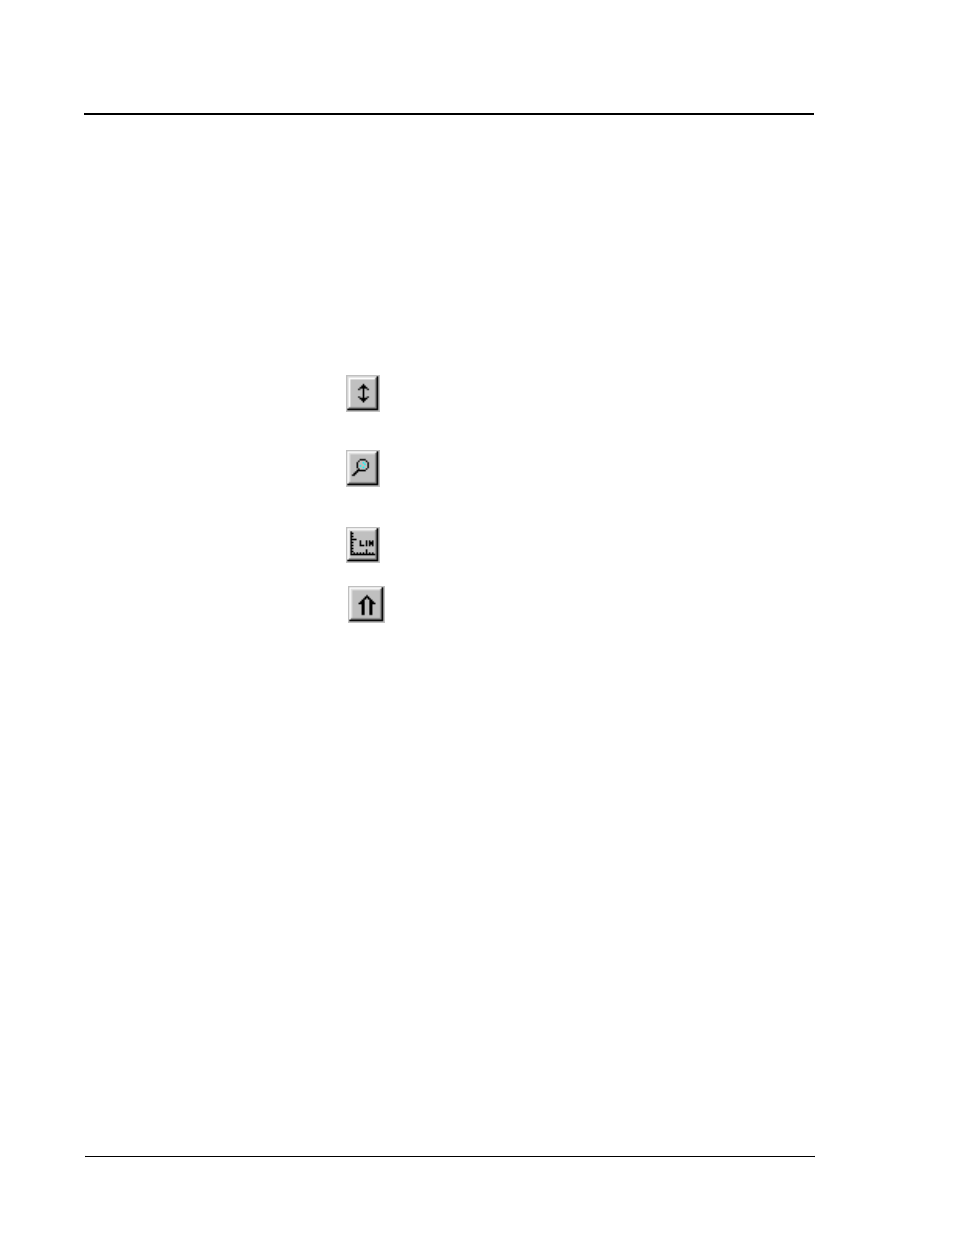
Auto scale.
Use this button to automatically adjust the
maximum number of events shown on the Y axis. Click
during acquisition to readjust the Y axis scale.
Zoom.
Use this button to enlarge a specific area on the
histogram display. Click and drag right to left to adjust the
graph’s range.
Log/linear.
Use this button to toggle the graph scale
between logarithmic and linear modes.
Maximize.
Use this button to enlarge the entire histogram
frame.
Dot Plot
The Dot Plot (commonly known as Bead Map) is located in the
lower-right section of the screen. See Figure 16. This display
provides a graphical display of the real-time data collection as a Dot
Plot. You can define the X axis and Y axis scales from within the
display, but we recommend using the default settings for collection
of data. The default axes are Classification 1 on the X axis and
Classification 2 on the Y axis. To see the Dot Plot, you must use the
default axis. To display the bead set information, hover the mouse
pointer over the desired region.
Note:
You may want to change the X axis and Y axis of the Dot Plot
for troubleshooting purposes. We highly recommend using the
default settings in all other instances.