Luminex 100 IS Version 2.2 User Manual
Page 29
x
MAP
Technology
Acquisition Detail Tab
PN 89-00002-00-032 Rev. A
23
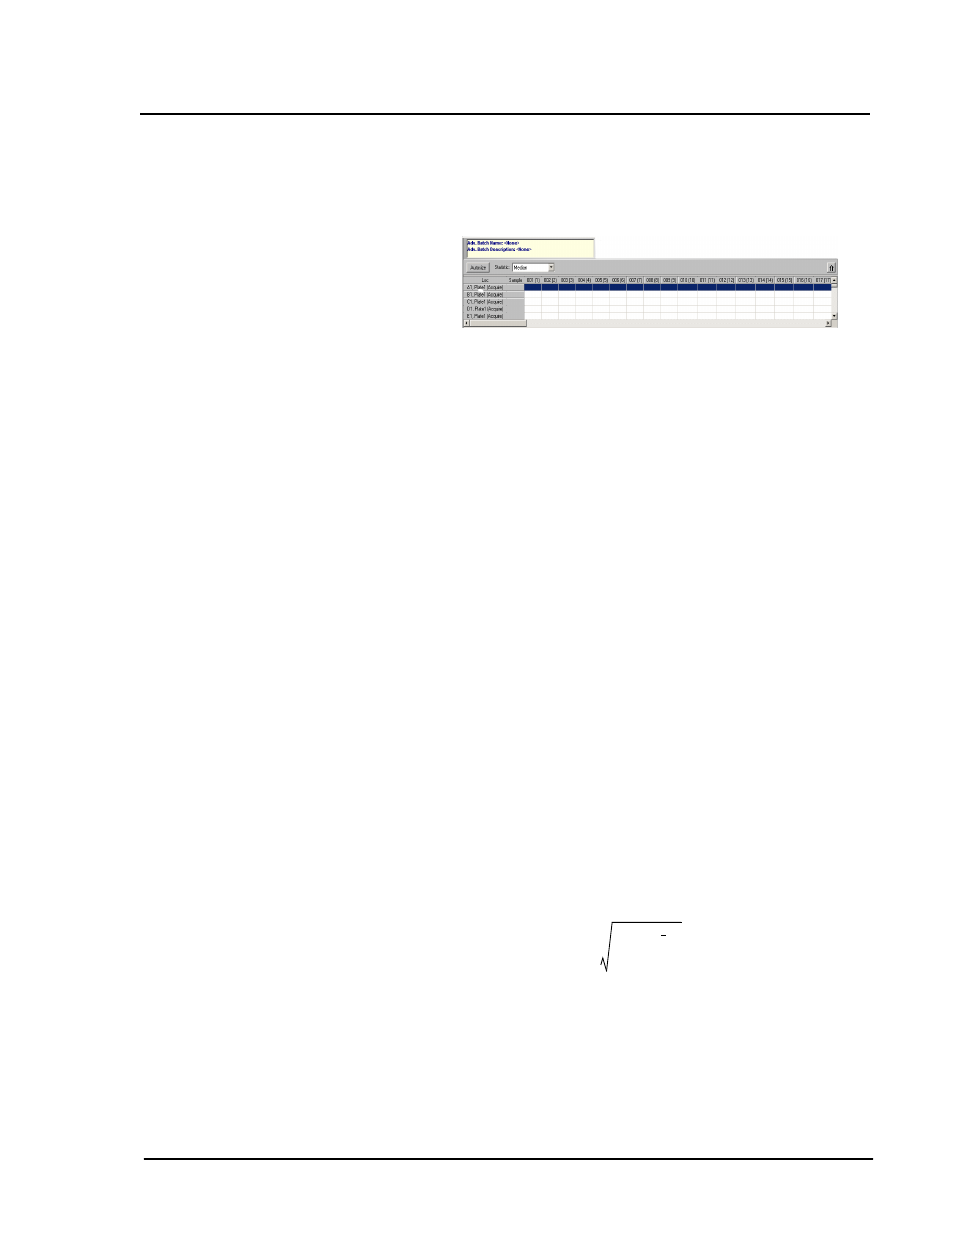
Batch Name and Description:
The Batch Name and Description are
displayed in the upper left corner of the Acquisition Detail tab. See
Figure 14.
Figure 14. Batch Name, Description, Autosize, and Statistics
Autosize.
This button automatically adjusts column widths to fit the
data and header sizes.
Statistics.
Defines which statistic you use to display your sample
data. Select an entry from the scroll list. There are eleven statistics:
Note:
This does not change the format of the expected data.
%CV
Trimmed %CV
Count
Trimmed Count
Mean
Trimmed Mean
Median*
Trimmed Peak
Peak
Trimmed StdDev
StdDev
*Luminex 100 IS software and Luminex 100 IS Developer
Workbench use only median statistics. However, you can
export the other statistics to reports. You define which statis-
tics to export through the Define Export tab on the Options
dialog box (select Tools Menu, then Options).
• %CV—Coefficient of Variation = Standard Deviation/Mean x
100%
• Count—Gated events, if gates are set
• Peak—Histogram bar with the highest value
• Std. Deviation—For calculating sample variability or
dispersion, Luminex uses the sample standard deviation. SD
Formula:
• Median—The point in a data set where there are as many
values occurring above it as there are below it.
• Mean—Average of all values in a set of results
• Trimmed—All trimmed statistics remove the lower and upper
five percent of the extreme statistic values, then use the
s
Σ x x
–
(
)
2
n 1
–
(
)
----------------------
=