Installation guide, Target dbg data screen - definitions, Saving meter configuration on a pc – Veris Industries FSRxxxx SERIES Install User Manual
Page 34: Printing a flow meter configuration report
FSRxxxx SERIES
Z205739-0D
PAGE 34
©2013 Veris Industries USA 800.354.8556 or +1.503.598.4564 / [email protected]
05131
Alta Labs, Enercept, Enspector, Hawkeye, Trustat, Aerospond, Veris, and the Veris ‘V’ logo are trademarks or registered trademarks of Veris Industries, L.L.C. in the USA and/or other countries.
TM
INSTALLATION GUIDE
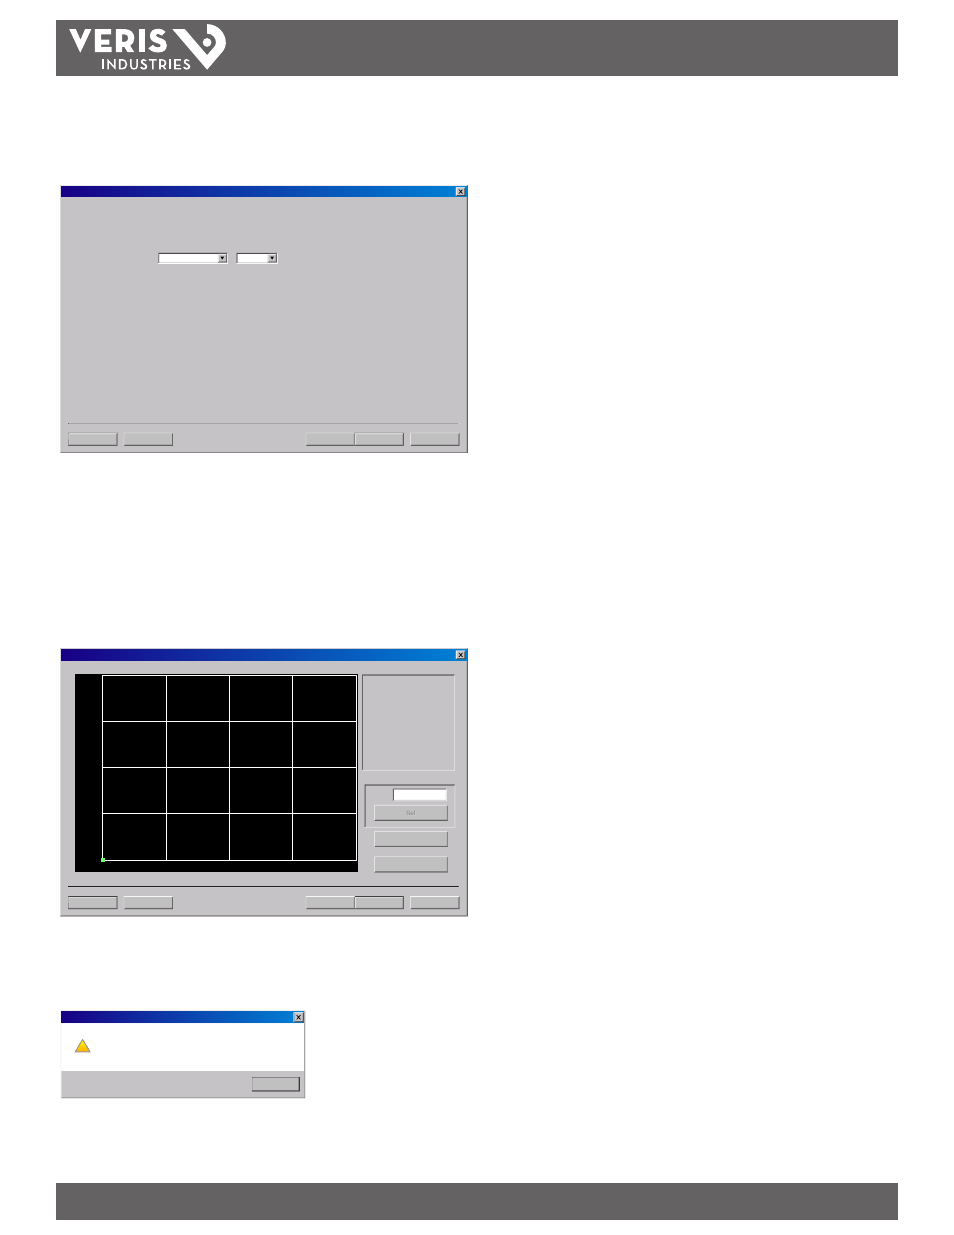
The second step (Page 2 of 3) in the calibration process is the selection of the
engineering units with which the calibration will be performed. Select the Flow Rate
Units and click the Next button at the bottom of the window.
Next>
Cancel File Open... File Save... Calibration (Page 2 of 3) - General Setup Gallons Min Flow Rate Units: / It is advisable to File Save the existing calibration before modifying it. If the Flow Rate Units selected on this page do not match the Flow Rate Units utilized for the existing data points collected on Page 3 of 3, flow measurement errors can occur. To view measurement units, go to Page 3 of 3 and press Edit. The Calibration Points Editor will show what units were used during the existing calibration. 1) If no data exists in the editor, selection of Flow Rate Units will not influence measurements. 2) If new calibration points are to be entered on Page 3 of 3, it is advisable to remove the existing calibration points using the Calibration Points Editor. Figure 5.9 - Calibration Page 2 of 3 Page 3 of 3 as shown in Figure 5.10 allows multiple actual flow rates to be recorded. Note: If only two points are to be used (zero and span), it is preferable to use the highest flow rate Next> Cancel File Open... File Save... Calibration (Page 2 of 3) - General Setup 1) Please establish a reference flow rate. 1FPS / 0.3MPS Minimum. 2) Enter the reference flow rate below. (Do not enter 0) 3) Wait for flow to stablize. 4 Press the Set button. G al/MIN Delta Time Flow: Export... Edit Figure 5.10 - Calibration Page 3 of 3 Zero values are not valid for linearization entries. Flow meter zero is entered on Page Calibration points are too close. Calibration not usable. USP OK ! Press the Finish button when all points have been entered. Target Dbg Data Screen - Definitions 1. Calc Count - The number of flow calculations performed since the meter was last power cycled. 2. Sample Count - The number of samples taken per second. 3. Raw Delta T (ηs) - The duration of one ultrasonic pulse crossing the pipe. 4. Course Delta T - The meter uses 2 wave forms: a coarse wave to find the best delay and other timing measurements, and a fine wave for the flow measurement. 5. Gain - The amount of signal amplification applied to the reflected ultrasound pulse to make it readable by the digital signal processor. 6. Gain Setting/Waveform Power - The first number is the gain setting on the digital pot (automatically controlled by the AGC circuit). Valid numbers are from 1 to 100. 7. Tx Delay - The amount of time the transmitting transducer waits for the receiving transducer to respond before the transmitter initiates another measurement 8. Flow Filter - The current value of the adaptive filter. 9. SS (Min/Max) - The minimum and maximum signal strength levels encountered by the meter beginning at the time the meter was power cycled. 10. Signal Strength State - Indicates whether the present signal strength minimum and maximum are within a pre-programmed signal strength window. 11. Sound Speed - The actual sound speed measured by the transducers. 12. Reynolds - A number indicating how turbulent a fluid is. Reynolds numbers between 0 and 2000 are considered laminar flow. Numbers between 2000 and 13. Reynolds Factor - The value applied to the flow calculation to correct for variations in Reynolds numbers. 14. Serial Number - The serial number reported by firmware. Saving Meter Configuration on a PC Save the complete configuration of the flow meter from the Configuration screen. Printing a Flow Meter Configuration Report Select File from the upper task bar and Print to calibration/configuration information
To calibrate a point, establish a stable, known flow rate (verified by a real-time
primary flow instrument), enter the actual flow rate in the Figure 5.10 window, and
click the Set button. Repeat for as many points as desired.
anticipated in normal operation as the calibration point. If an erroneous data point is collected,
remove it pressing the Edit button, selecting the bad point, and then selecting Remove.
1 of 3. The following error message appeard if a zero calibration point is attempted.
The second number is the power factor of the current waveform. For example “8”
indicates a 1/8 power wave form.
cycle.
4000 are in transition between laminar and turbulent flows. Numbers greater
than 4000 indicate turbulent flow.
Select the File Save button located in the lower left-hand corner of the screen and
name the file. Files are saved as a *.dcf extension. This file may be transferred to
other flow meters or may be recalled should the same pipe be surveyed again or
multiple meters programmed with the same information.
sheet for the installation.