Tenant traffic rate chart – H3C Technologies H3C Intelligent Management Center User Manual
Page 88
78
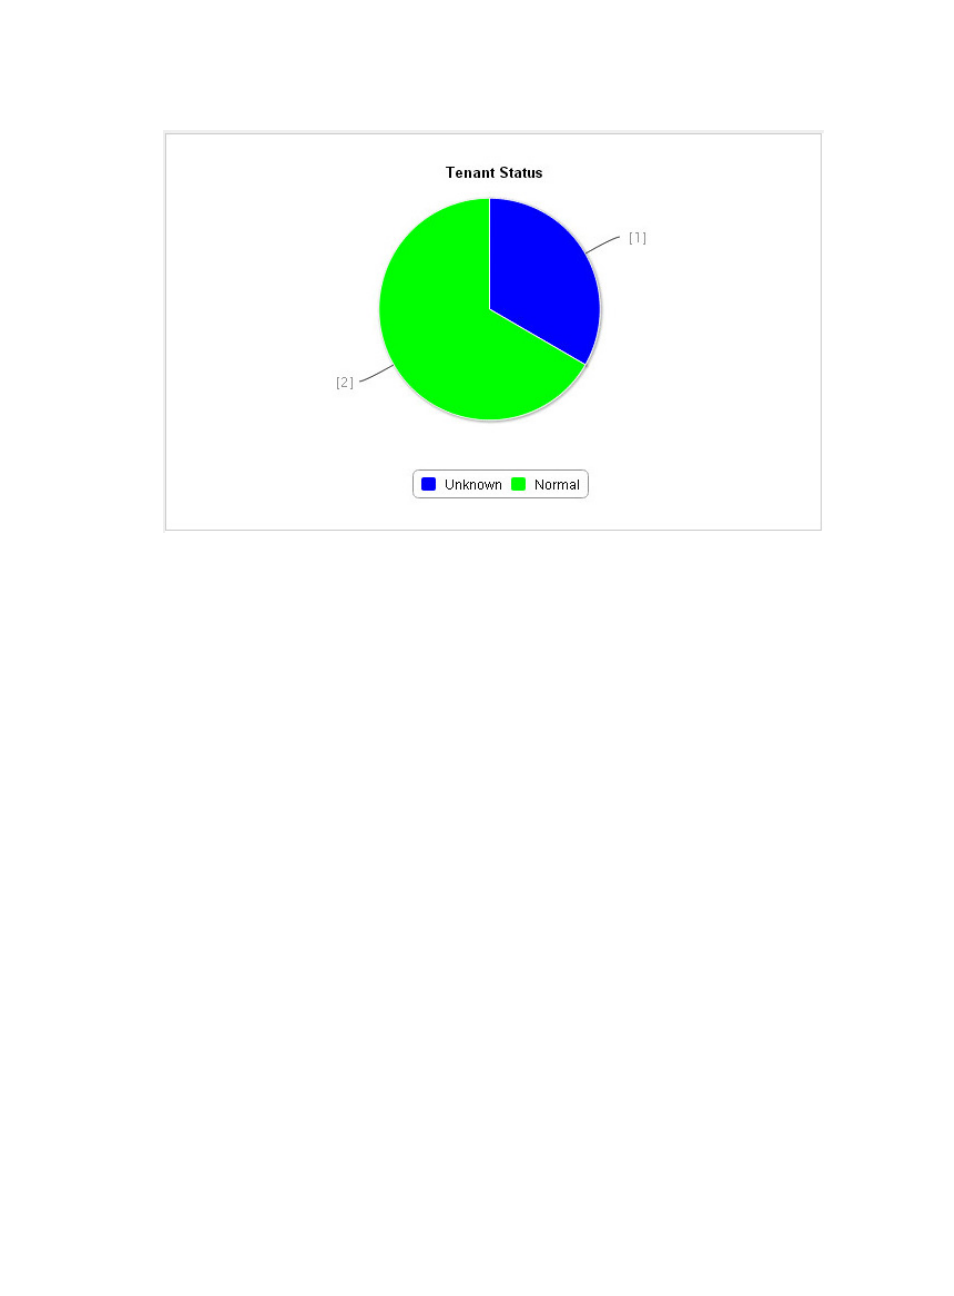
Figure 26 Tenant status
Tenant traffic rate chart
The tenant traffic rate chart displays the receiving and transmitting rate trend of virtual OpenFlow devices
rent by a tenant over a time range. The x-axis shows the time. The y-axis shows the rate. The receiving and
transmitting rates are represented in different colors.
By default, the chart displays the rate trend from 00:00 to the current time.
1.
Click 1h, 1d, 1w, 1m, or 1y to view the tenant rate trend over the most recent hour, most recent
day, most recent week, most recent month, or most recent year, respectively, or click Customize to
set the start time and end time for query.
2.
Select the tenant to view from the Select Tenant list.
3.
Click a legend to hide or show the rate in the line chart.
- H3C SecPath L1000-A Load Balancer (8 pages)
- H3C SecPath M9000 Series (42 pages)
- H3C Device Manager (191 pages)
- H3C SecPath U200-A U200-M U200-S (19 pages)
- H3C SecPath F100-C-SI (206 pages)
- H3C SecPath U200-A U200-M U200-S (57 pages)
- H3C SecPath U200-A U200-M U200-S (182 pages)
- H3C SecPath U200-CA U200-CM U200-CS (95 pages)
- H3C SecPath U200-A U200-M U200-S (198 pages)
- H3C SecPath U200-A U200-M U200-S (80 pages)
- H3C SecPath U200-A U200-M U200-S (326 pages)
- H3C SecPath F100-C-SI (126 pages)
- H3C SecPath U200-A U200-M U200-S (225 pages)
- H3C SecPath F100-C-SI (68 pages)
- H3C SecPath F100-C-SI (99 pages)
- H3C SecPath F100-C-SI (273 pages)
- H3C SecPath F100-C-SI (234 pages)
- H3C SecPath F100-C-SI (490 pages)
- H3C SecPath U200-A U200-M U200-S (397 pages)
- H3C SecPath F100-C-SI (967 pages)
- H3C SecBlade FW Cards (938 pages)
- H3C SecPath U200-CA U200-CM U200-CS (84 pages)
- H3C SecPath F5000-A5 Firewall (121 pages)
- H3C SecPath F5000-C Firewall (2 pages)
- H3C SecPath F5040 (86 pages)
- H3C SecPath F5000-C Firewall (4 pages)
- H3C SecBlade FW Cards (12 pages)
- H3C SecBlade FW Cards (16 pages)
- H3C SecBlade FW Cards (6 pages)
- H3C SecPath U200-CA U200-CM U200-CS (45 pages)
- H3C SecBlade FW Cards (21 pages)
- H3C SecBlade IPS Cards (31 pages)
- H3C SecPath U200-CA U200-CM U200-CS (18 pages)
- H3C SecBlade IPS Cards (85 pages)
- H3C SecBlade IPS Cards (219 pages)
- H3C SecBlade SSL VPN Cards (21 pages)
- H3C SecBlade NetStream Cards (349 pages)
- H3C SecPath L1000-A Load Balancer (66 pages)
- H3C SecPath L1000-A Load Balancer (196 pages)
- H3C SecPath L1000-A Load Balancer (114 pages)
- H3C SecPath L1000-A Load Balancer (165 pages)
- H3C SecPath L1000-A Load Balancer (278 pages)
- H3C SecPath U200-A U200-M U200-S (83 pages)
- H3C SecPath L1000-A Load Balancer (8 pages)
- H3C VMSG VFW1000 (36 pages)