Viewing today's top n tenant traffic – H3C Technologies H3C Intelligent Management Center User Manual
Page 27
17
•
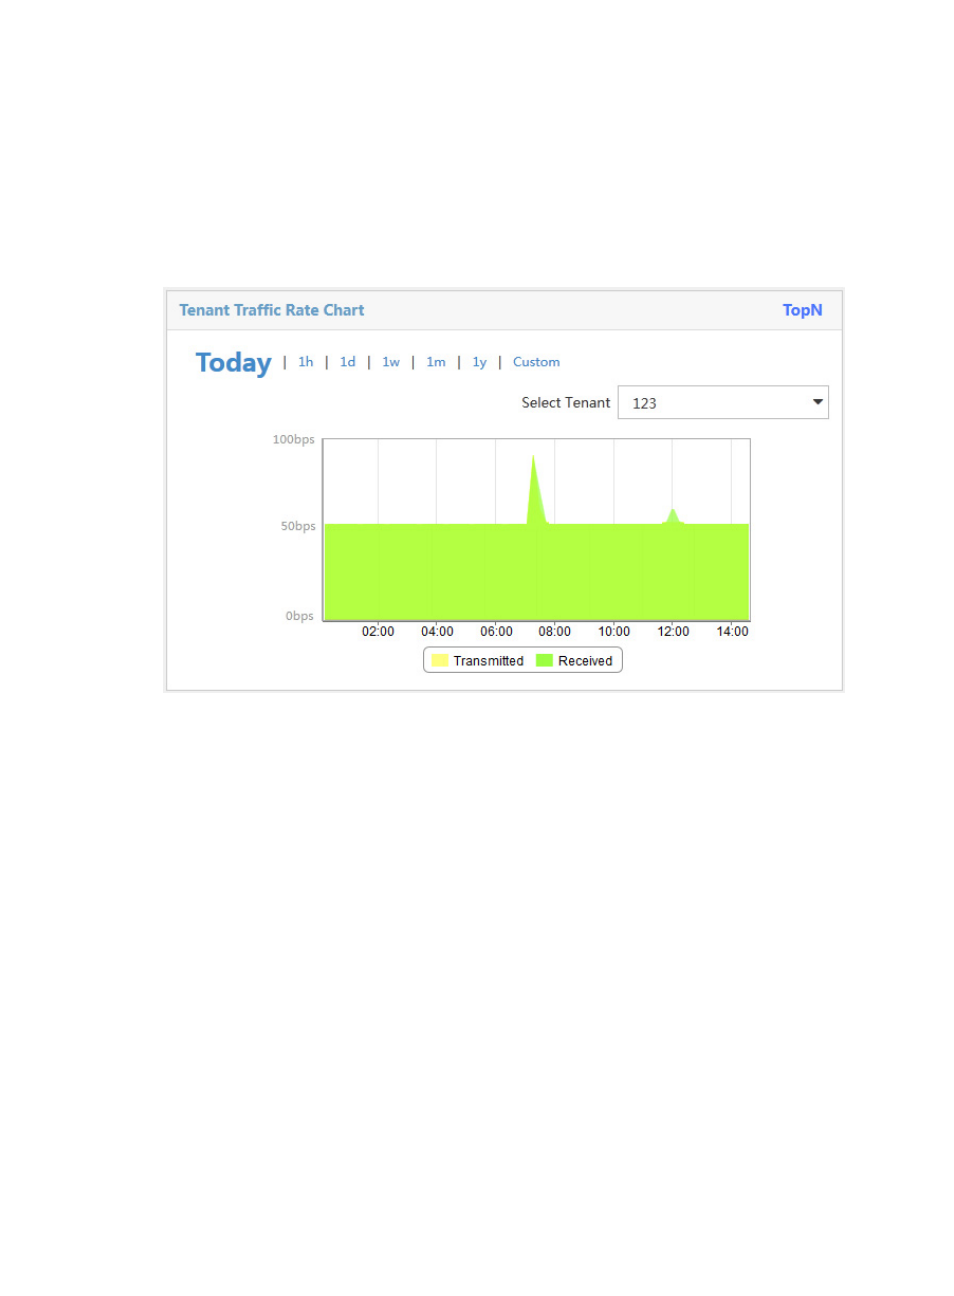
Select a tenant from the Select Tenant list to display its rate trend.
•
Click 1h, 1d, 1w, 1m, or 1y to view the rate trend of the tenant in the corresponding time range.
•
Click Custom, select a start time and end time in the calendar that appears, and click Query to view
the rate trend of the tenant in the specified time range.
•
Move the pointer over an edge of the transmitted or received area to view the rate at a specified
time.
Figure 14 Tenant traffic rate chart
Viewing today's top N tenant traffic
Today's Top N Tenant Traffic displays the top N tenants with the highest traffic volume from 00:00:00 of
the day to the current time.
From the TopN list, select the maximum number of tenants to display in the list. Options are:
•
5
•
10
•
20
•
50
•
100
- H3C SecPath L1000-A Load Balancer (8 pages)
- H3C SecPath M9000 Series (42 pages)
- H3C Device Manager (191 pages)
- H3C SecPath U200-A U200-M U200-S (19 pages)
- H3C SecPath F100-C-SI (206 pages)
- H3C SecPath U200-A U200-M U200-S (57 pages)
- H3C SecPath U200-A U200-M U200-S (182 pages)
- H3C SecPath U200-CA U200-CM U200-CS (95 pages)
- H3C SecPath U200-A U200-M U200-S (198 pages)
- H3C SecPath U200-A U200-M U200-S (80 pages)
- H3C SecPath U200-A U200-M U200-S (326 pages)
- H3C SecPath F100-C-SI (126 pages)
- H3C SecPath U200-A U200-M U200-S (225 pages)
- H3C SecPath F100-C-SI (68 pages)
- H3C SecPath F100-C-SI (99 pages)
- H3C SecPath F100-C-SI (273 pages)
- H3C SecPath F100-C-SI (234 pages)
- H3C SecPath F100-C-SI (490 pages)
- H3C SecPath U200-A U200-M U200-S (397 pages)
- H3C SecPath F100-C-SI (967 pages)
- H3C SecBlade FW Cards (938 pages)
- H3C SecPath U200-CA U200-CM U200-CS (84 pages)
- H3C SecPath F5000-A5 Firewall (121 pages)
- H3C SecPath F5000-C Firewall (2 pages)
- H3C SecPath F5040 (86 pages)
- H3C SecPath F5000-C Firewall (4 pages)
- H3C SecBlade FW Cards (12 pages)
- H3C SecBlade FW Cards (16 pages)
- H3C SecBlade FW Cards (6 pages)
- H3C SecPath U200-CA U200-CM U200-CS (45 pages)
- H3C SecBlade FW Cards (21 pages)
- H3C SecBlade IPS Cards (31 pages)
- H3C SecPath U200-CA U200-CM U200-CS (18 pages)
- H3C SecBlade IPS Cards (85 pages)
- H3C SecBlade IPS Cards (219 pages)
- H3C SecBlade SSL VPN Cards (21 pages)
- H3C SecBlade NetStream Cards (349 pages)
- H3C SecPath L1000-A Load Balancer (66 pages)
- H3C SecPath L1000-A Load Balancer (196 pages)
- H3C SecPath L1000-A Load Balancer (114 pages)
- H3C SecPath L1000-A Load Balancer (165 pages)
- H3C SecPath L1000-A Load Balancer (278 pages)
- H3C SecPath U200-A U200-M U200-S (83 pages)
- H3C SecPath L1000-A Load Balancer (8 pages)
- H3C VMSG VFW1000 (36 pages)