Today tenant traffic rate chart, N in, Figure 50 – H3C Technologies H3C Intelligent Management Center User Manual
Page 136
126
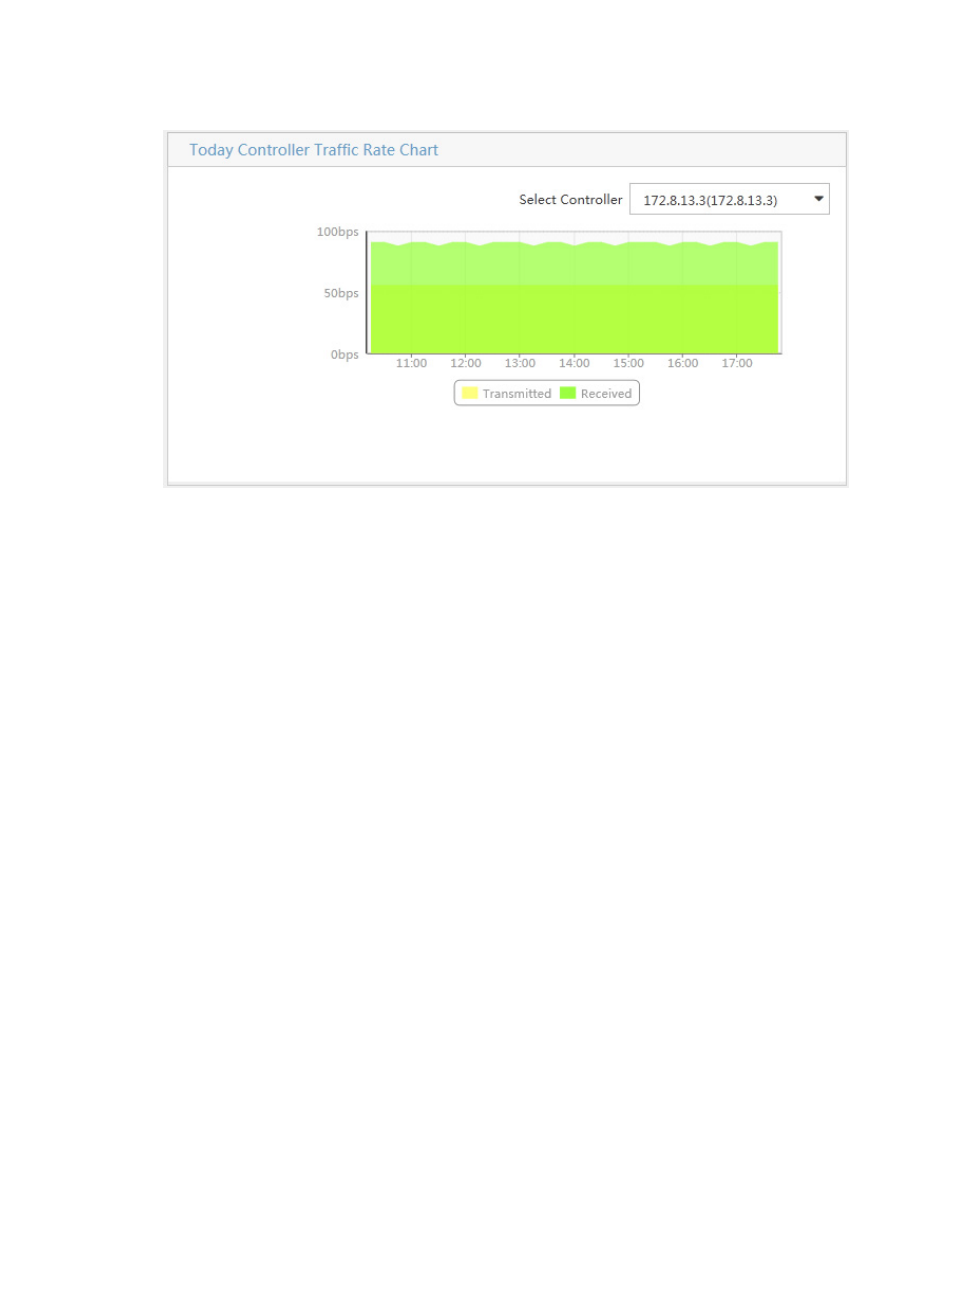
Figure 50 Today controller traffic rate chart
The Select Controller list contains all controllers in SDN Manager. Select one from the list to display its
rate trend. By default, the widget displays the rate trend of the controller with the highest traffic volume.
You can perform the following operations:
•
Move the pointer over a peak of the transmitted or received area to view the peak rate at a specified
time.
•
Click the legend name in the illustration to hide or display a rate trend area.
•
Place the pointer at one point and drag the pointer to the left or right to view the rate trend in a more
specific time range.
•
Click Resume to restore the default display.
Today Tenant Traffic Rate Chart
As shown in
, Today Tenant Traffic Rate Chart displays the rate trend of the tenant with the
highest traffic volume from 00:00:00 of the day to the current time.
- H3C SecPath L1000-A Load Balancer (8 pages)
- H3C SecPath M9000 Series (42 pages)
- H3C Device Manager (191 pages)
- H3C SecPath U200-A U200-M U200-S (19 pages)
- H3C SecPath F100-C-SI (206 pages)
- H3C SecPath U200-A U200-M U200-S (57 pages)
- H3C SecPath U200-A U200-M U200-S (182 pages)
- H3C SecPath U200-CA U200-CM U200-CS (95 pages)
- H3C SecPath U200-A U200-M U200-S (198 pages)
- H3C SecPath U200-A U200-M U200-S (80 pages)
- H3C SecPath U200-A U200-M U200-S (326 pages)
- H3C SecPath F100-C-SI (126 pages)
- H3C SecPath U200-A U200-M U200-S (225 pages)
- H3C SecPath F100-C-SI (68 pages)
- H3C SecPath F100-C-SI (99 pages)
- H3C SecPath F100-C-SI (273 pages)
- H3C SecPath F100-C-SI (234 pages)
- H3C SecPath F100-C-SI (490 pages)
- H3C SecPath U200-A U200-M U200-S (397 pages)
- H3C SecPath F100-C-SI (967 pages)
- H3C SecBlade FW Cards (938 pages)
- H3C SecPath U200-CA U200-CM U200-CS (84 pages)
- H3C SecPath F5000-A5 Firewall (121 pages)
- H3C SecPath F5000-C Firewall (2 pages)
- H3C SecPath F5040 (86 pages)
- H3C SecPath F5000-C Firewall (4 pages)
- H3C SecBlade FW Cards (12 pages)
- H3C SecBlade FW Cards (16 pages)
- H3C SecBlade FW Cards (6 pages)
- H3C SecPath U200-CA U200-CM U200-CS (45 pages)
- H3C SecBlade FW Cards (21 pages)
- H3C SecBlade IPS Cards (31 pages)
- H3C SecPath U200-CA U200-CM U200-CS (18 pages)
- H3C SecBlade IPS Cards (85 pages)
- H3C SecBlade IPS Cards (219 pages)
- H3C SecBlade SSL VPN Cards (21 pages)
- H3C SecBlade NetStream Cards (349 pages)
- H3C SecPath L1000-A Load Balancer (66 pages)
- H3C SecPath L1000-A Load Balancer (196 pages)
- H3C SecPath L1000-A Load Balancer (114 pages)
- H3C SecPath L1000-A Load Balancer (165 pages)
- H3C SecPath L1000-A Load Balancer (278 pages)
- H3C SecPath U200-A U200-M U200-S (83 pages)
- H3C SecPath L1000-A Load Balancer (8 pages)
- H3C VMSG VFW1000 (36 pages)