Flow table traffic statistic report – H3C Technologies H3C Intelligent Management Center User Manual
Page 121
111
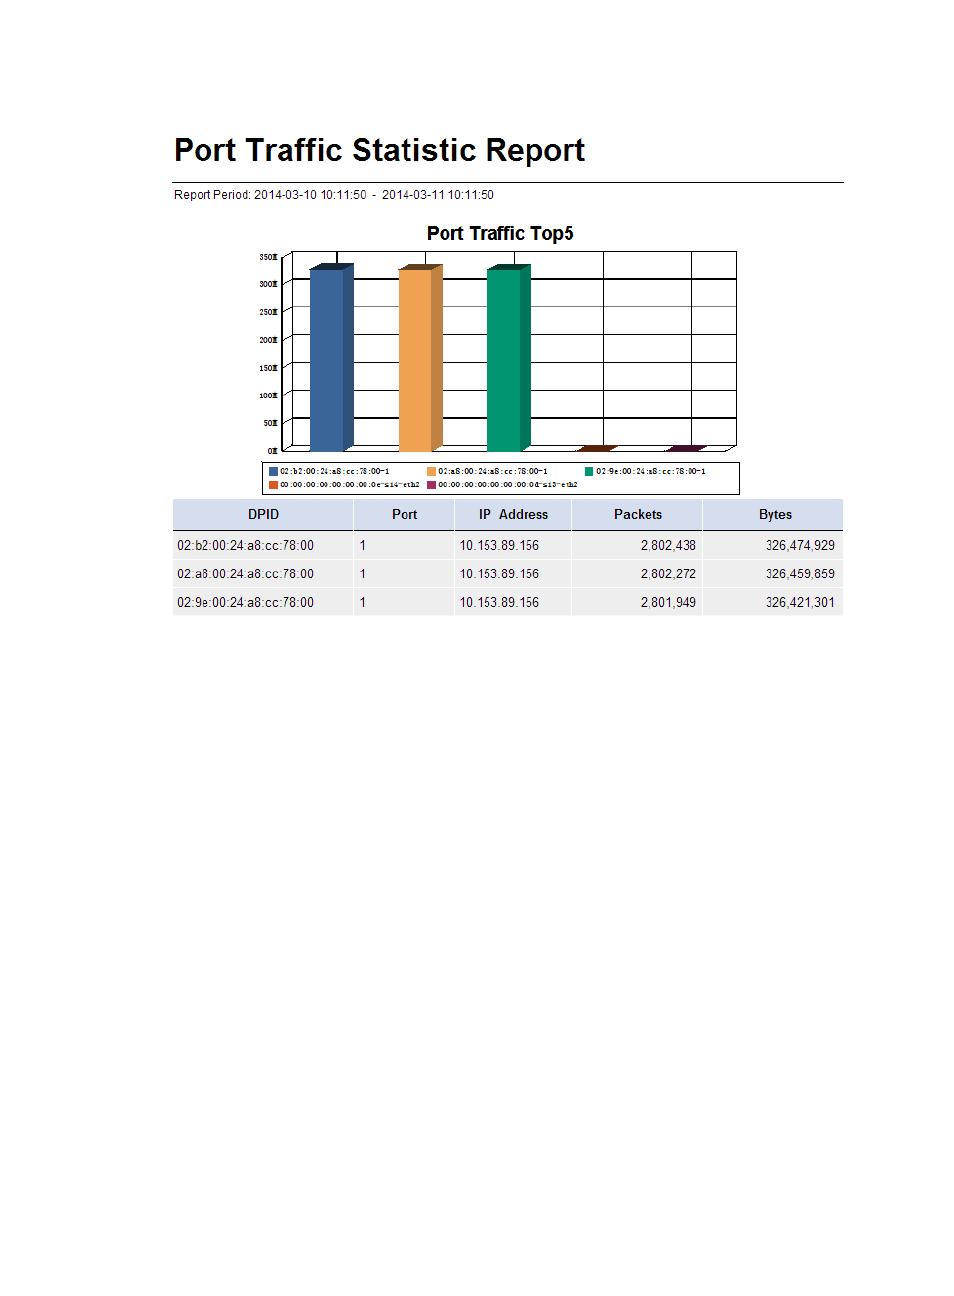
Figure 37 Port traffic statistic report
The port traffic statistic report contains the following fields:
•
Report Period—Statistics collection time range of the report.
•
Port Traffic Top 5—Top five ports with the highest traffic amount. The y axis shows the traffic amount
in bytes. The x axis shows the ports by DPID-Port.
•
DPID—DPID of the OpenFlow instance to which the port is assigned.
•
Port—Port index assigned by the OpenFlow switch to uniquely identify the port in the OpenFlow
instance.
•
IP Address—IP address of the OpenFlow switch where the port resides.
•
Packets—Total number of packets received and sent by the port in the specified time range.
•
Bytes—Total number of bytes received and sent by the port in the specified time range.
Flow Table Traffic Statistic Report
The flow table traffic statistic report displays the total amount of traffic received and sent by each flow
table in the OpenFlow instances over a specific time range.
To view a flow table traffic statistic report, specify the following parameters on the Set Parameter page:
•
Parameter "Begin Time" and "End Time"—Select a statistics collection time range from the list.
Options are:
{
Last Hour
{
Last Day
{
Last Week