Monitor cluster activity, Set apple qadministrator preferences – Apple Compressor (4.0) User Manual
Page 262
Chapter 9
Use Apple Qadministrator to create and modify clusters
262
Monitor cluster activity
You can use Apple Qadministrator to find out what’s happening within a cluster by examining
details (such as processor usage, which batch is being processed, disk space usage, and data
activity) about each node in the cluster.
You can also view log information for a selected service or cluster. This information is useful for
troubleshooting distributed processing issues, and it can be saved to a file and processed with
XML tools and UNIX scripts.
View cluster activity
1
In the Cluster list on the left side of the Apple Qadministrator window, select the cluster you
want to examine.
2
Select a node in the cluster’s service nodes list (in the Services tab).
3
Click the Info (i) button near the bottom of the Cluster list.
4
In the window that appears, click the CPU, Memory, Volume Info, and I/O Activity tabs to see a
variety of details about the selected node.
View or copy log information
1
In the Cluster list, select the service or cluster whose log you want to view.
2
Click the Log button near the bottom of the Cluster list.
A new window appears, displaying the log information for the selected service or cluster. The log
file is deleted when you close the window.
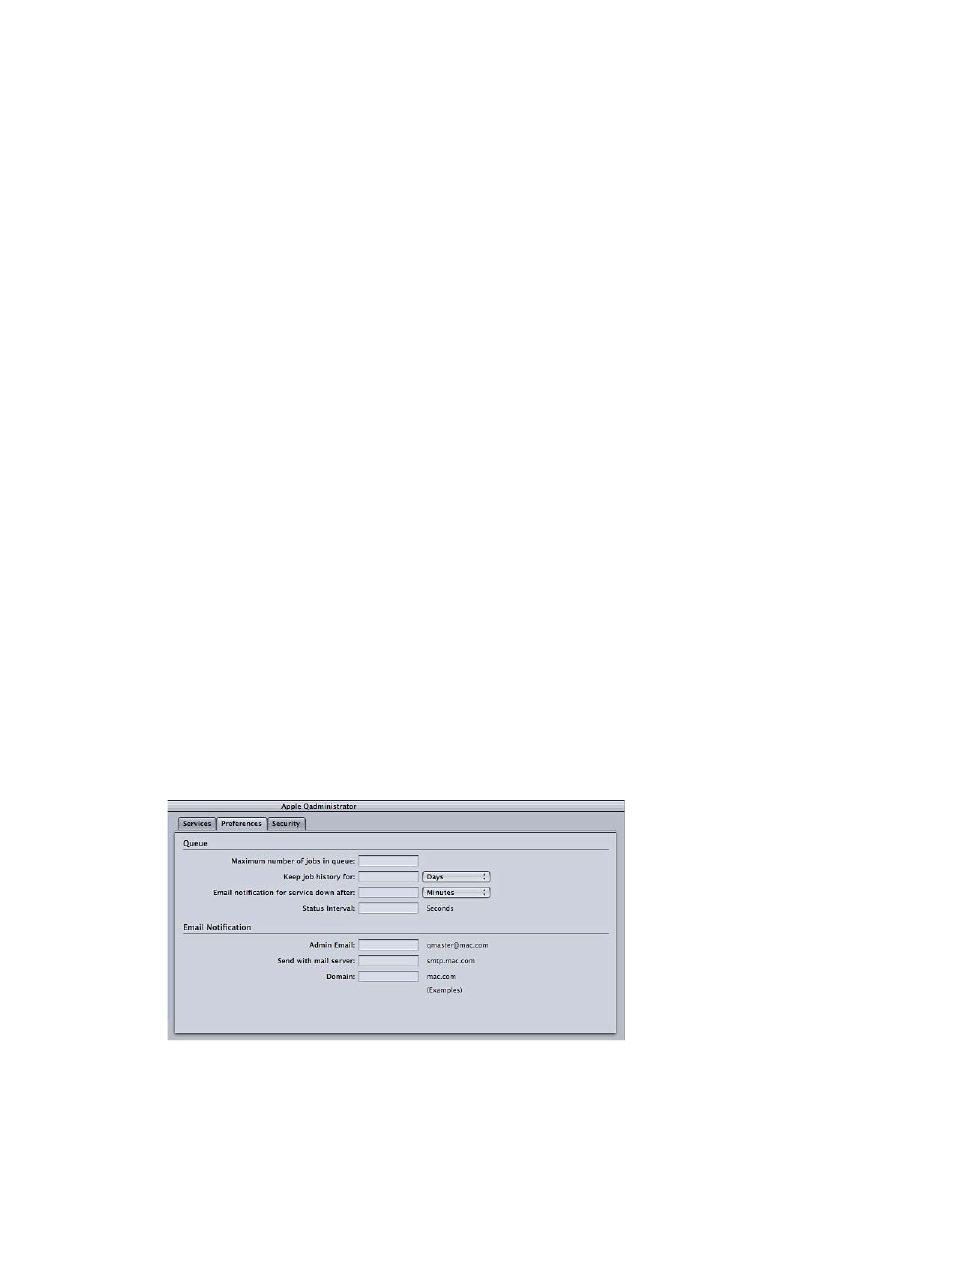
Set Apple Qadministrator preferences
Apple Qadministrator preferences apply to specific clusters and also to using Apple
Qadministrator over a wide area network.
Set preferences for a cluster or for using Apple Qadministrator over a wide area network
1
Open Apple Qadministrator.
2
In the Cluster list on the left side of the window, select the cluster for which you want to
set preferences.
3
Click the Preferences tab.