1 frequency resolution, Table 73. example. e for a 10 hz input signal – Campbell Scientific CR3000 Micrologger User Manual
Page 324
Section 8. Operation
324
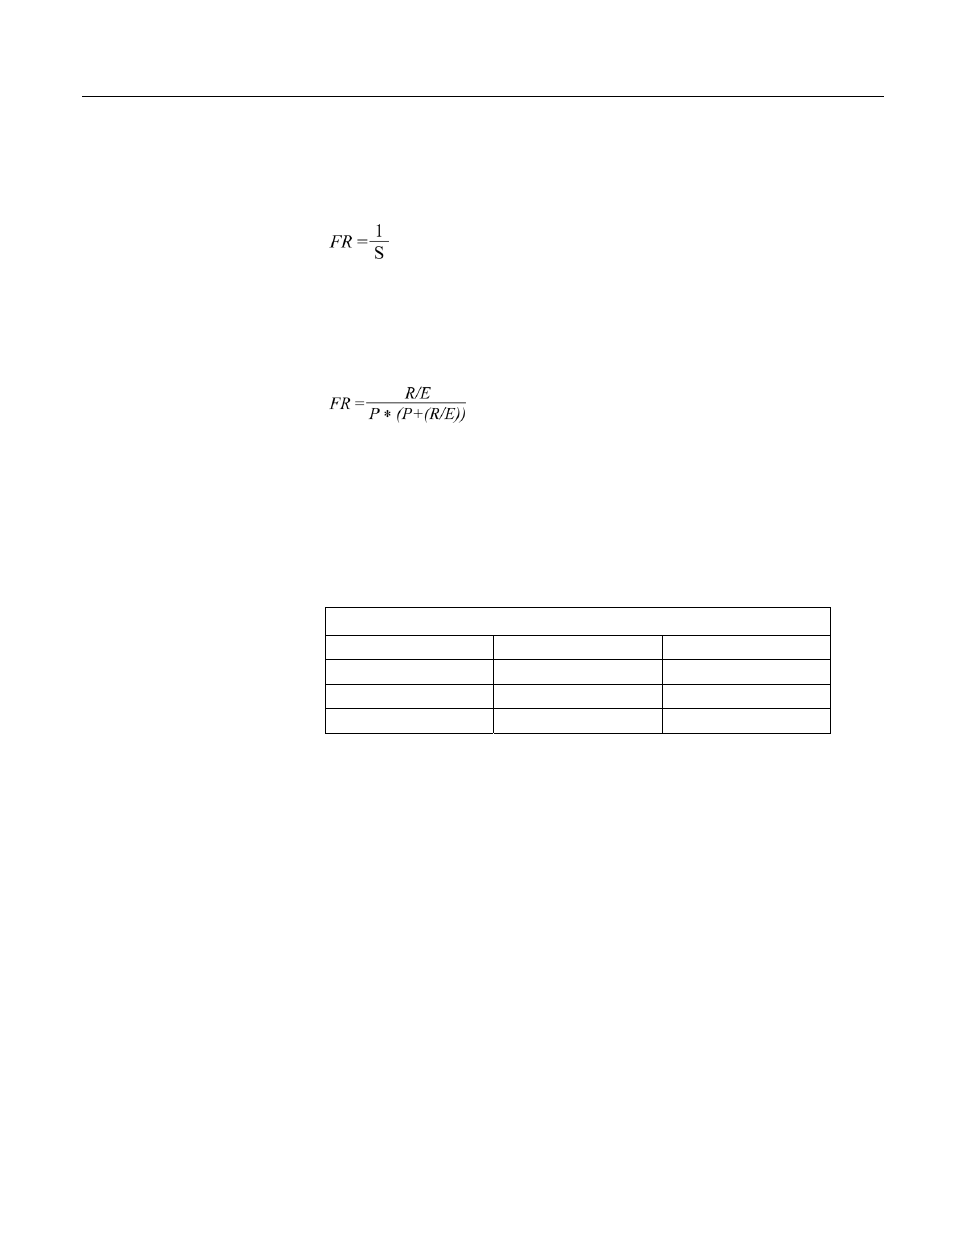
8.1.5.3.1 Frequency Resolution
Frequency resolution of a PulseCount() frequency measurement is calculated as
where:
FR = Resolution of the frequency measurement (Hz)
S = Scan Interval of CRBasic Program
Resolution of TimerIO() instruction is:
where:
FR = Frequency resolution of the measurement (Hz)
R = Timing resolution of the TimerIO() measurement = 540 ns136 ns
P = Period of input signal (seconds). For example, P = 1 / 1000 Hz =
0.001 s
E = Number of rising edges per scan or 1, whichever is greater.
Table 73. Example. E for a 10 Hz input signal
Scan
Rising Edge / Scan
E
5.0 50 50
0.5 5 5
0.05 0.5 1
TimerIO() instruction measures frequencies of ≤ 1 kHz with higher frequency
resolution over short (sub-second) intervals. In contrast, sub-second frequency
measurement with PulseCount() produce measurements of lower resolution.
Consider a 1-kHz input. Table Frequency Resolution Comparison
(p. 325)
lists
frequency resolution to be expected for a 1-kHz signal measured by TimerIO()
and PulseCount() at 0.5-s and 5.0-s scan intervals.
Increasing a measurement interval from 1 second to 10 seconds, either by
increasing the scan interval (when using PulseCount()) or by averaging (when
using PulseCount() or TimerIO()), improves the resulting frequency resolution
from 1 Hz to 0.1 Hz. Averaging can be accomplished by the Average(),
AvgRun(), and AvgSpa() instructions. Also, PulseCount() has the option of
entering a number greater than 1 in the
POption
parameter. Doing so enters an
averaging interval in milliseconds for a direct running average computation.
However, use caution when averaging, Averaging of any measurement reduces
the certainty that the result truly represents a real aspect of the phenomenon being
measured.