5 gathering and displaying system environment data, 4 services monitored by nagios – HP Insight Control Software for Linux User Manual
Page 164

NOTE:
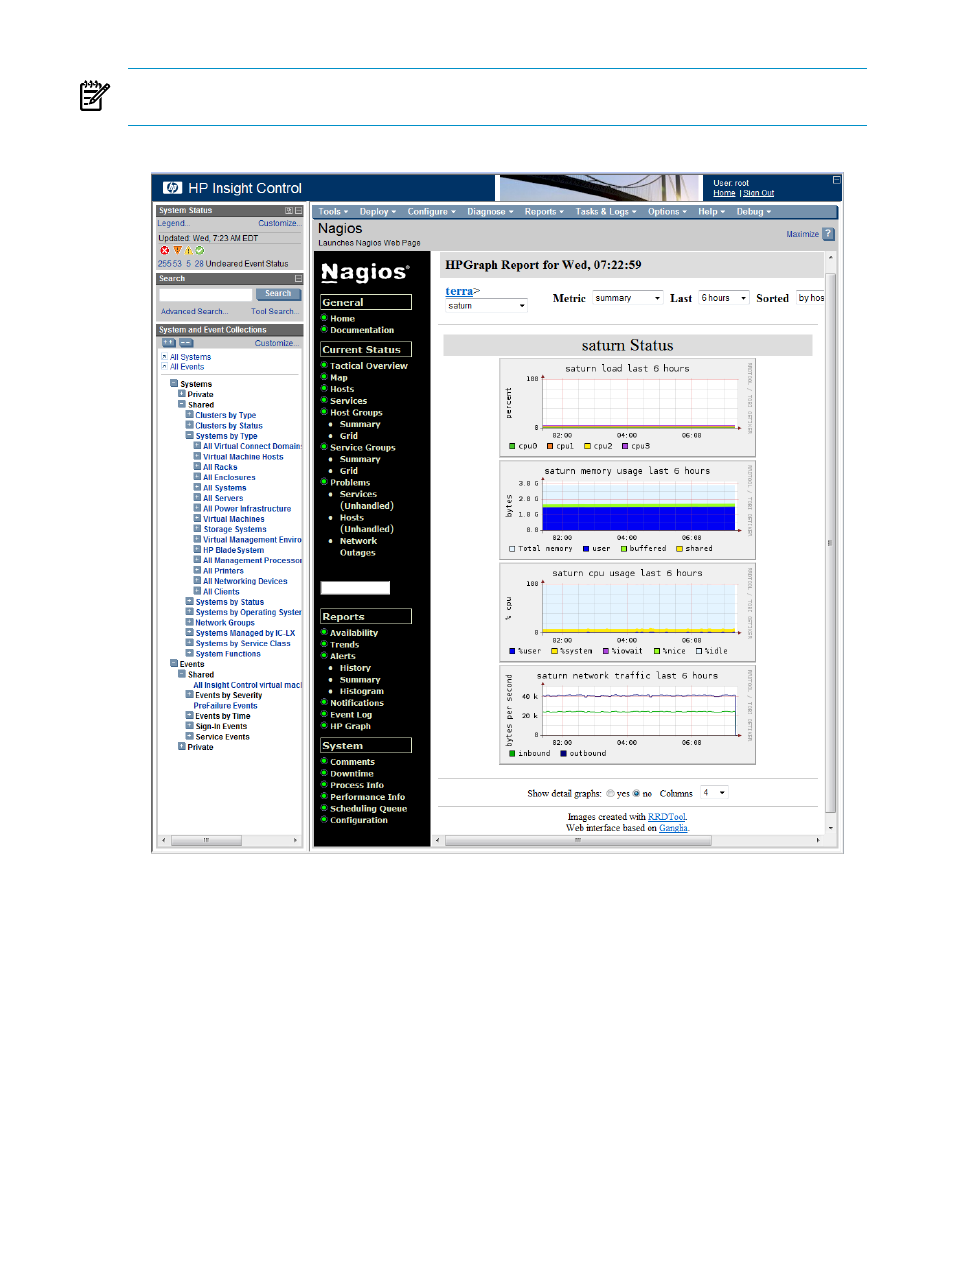
The detail graphs for a system show the graphs for a specified metric on all Nagios
hosts. The detail graphs for a Nagios host show all applicable metrics for that Nagios host.
Figure 14-11 HP Graph host display for one managed system
14.3.5 Gathering and displaying system environment data
HP Insight Control for Linux provides plug-ins that monitor the environment data on each
managed system such as temperature and fan speed, which can be indicators of possible system
failure.
To display environment data, select the Service Problems menu item in the left frame of the
Nagios main window to open the Service Status for All Hosts window.
You can also use the shownode metrics sensors command to display environmental data.
See
for more information.
14.4 Services monitored by Nagios
Services, also referred to as plug-ins, typically gather information for many managed systems
at a time and apply the information to Nagios through the Nagios FIFO (passive checks) on a
managed system basis.
164
Using graphical tools to monitor managed systems
- Scripting Toolkit for Linux (68 pages)
- Scripting Toolkit for Windows 9.50 (62 pages)
- Scripting Toolkit for Windows 9.60 (62 pages)
- Storage Area Manager (13 pages)
- Core HP-UX (5 pages)
- Matrix Operating Environment Software (128 pages)
- Matrix Operating Environment Software (104 pages)
- Matrix Operating Environment Software (75 pages)
- Matrix Operating Environment Software (245 pages)
- Matrix Operating Environment Software (209 pages)
- Matrix Operating Environment Software (71 pages)
- Matrix Operating Environment Software (239 pages)
- Matrix Operating Environment Software (107 pages)
- Matrix Operating Environment Software (77 pages)
- Insight Management-Software (148 pages)
- Matrix Operating Environment Software (80 pages)
- Insight Management-Software (128 pages)
- Matrix Operating Environment Software (132 pages)
- Matrix Operating Environment Software (74 pages)
- Matrix Operating Environment Software (76 pages)
- Matrix Operating Environment Software (233 pages)
- Matrix Operating Environment Software (61 pages)
- Matrix Operating Environment Software (232 pages)
- Matrix Operating Environment Software (70 pages)
- Matrix Operating Environment Software (120 pages)
- Matrix Operating Environment Software (36 pages)
- Matrix Operating Environment Software (99 pages)
- Matrix Operating Environment Software (192 pages)
- Matrix Operating Environment Software (198 pages)
- Matrix Operating Environment Software (66 pages)
- Matrix Operating Environment Software (95 pages)
- Matrix Operating Environment Software (152 pages)
- Matrix Operating Environment Software (264 pages)
- Matrix Operating Environment Software (138 pages)
- Matrix Operating Environment Software (137 pages)
- Matrix Operating Environment Software (97 pages)
- Matrix Operating Environment Software (33 pages)
- Matrix Operating Environment Software (142 pages)
- Matrix Operating Environment Software (189 pages)
- Matrix Operating Environment Software (58 pages)
- Matrix Operating Environment Software (68 pages)
- Matrix Operating Environment Software (79 pages)
- Matrix Operating Environment Software (223 pages)
- Matrix Operating Environment Software (136 pages)
- Matrix Operating Environment Software (34 pages)
