Viewing drive performance and utilization graph – HP Command View for Tape Libraries Software User Manual
Page 76
The Collection Status provides three help links for:
•
Configuring ESL, EML, ESL G3, or MSL6480 libraries to send TapeAssure data to this
Management Station
•
Configuring MSL libraries to send TapeAssure data to this Management Station
•
Configuring Standalone Drives for TapeAssure
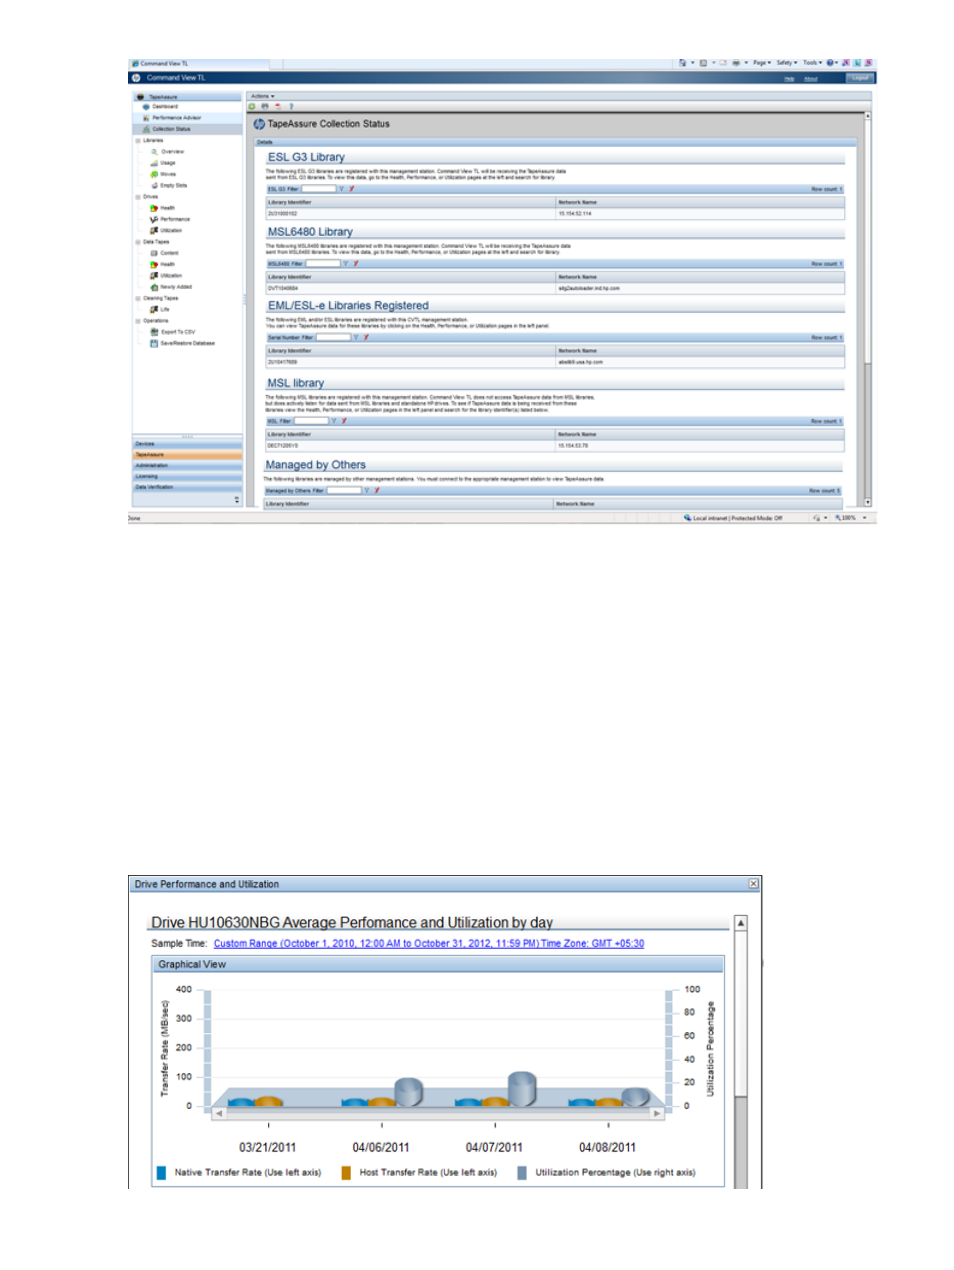
Viewing drive performance and utilization graph
The drive performance and utilization graph shows performance and utilization information for a
particular drive for each day during the time interval selected. The bar graph shows three bars for
each day: native transfer rate and host transfer rate (for performance), and utilization. Beneath
the graph, the data is shown in a table.
To plot the graph, click any data point in the Performance Advisor graph or click on any of the
legends listed on the right. The Drive Performance and Utilization graph is displayed.
76
Command View TL GUI