Creating – HP XP Performance Advisor Software User Manual
Page 304

. In addition, ensure that the following steps specific to an LDEV Activity report are also
completed:
1.
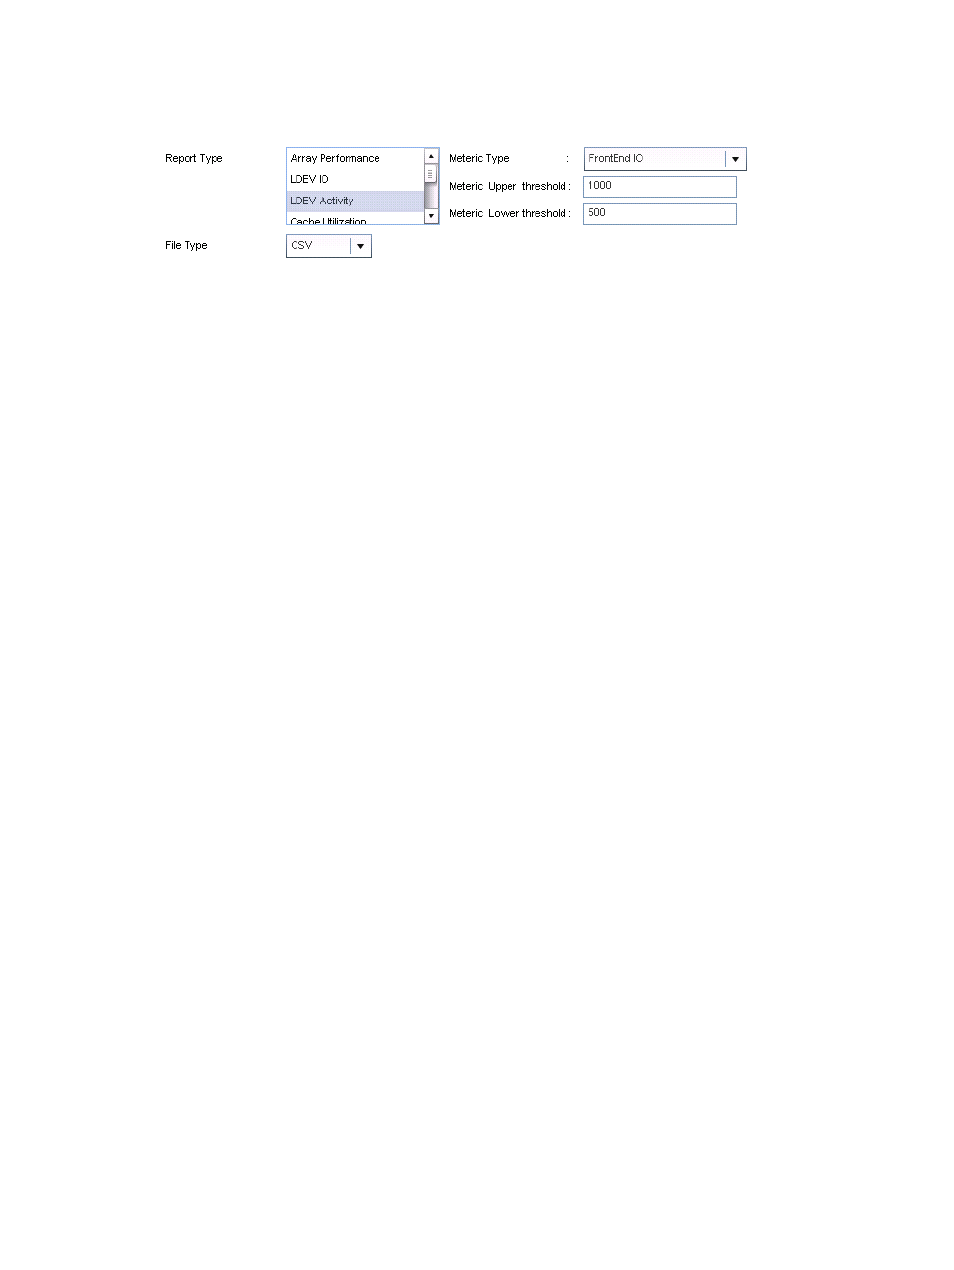
Select LDEV Activity from the Report Type list.
2.
Select the Metric Type as:
•
FontEndIO: Select this metric type to view a report of the most active or the least active
LDEVs (or both) based on the threshold specified for the total frontend I/Os.
•
BackEndIO: Select this metric type to view a report of the most active or the least active
LDEVs (or both) based on the threshold specified for the total backend transfers.
•
MB: Select this metric type to view a report of the most active or the least active LDEVs
(or both) based on the threshold specified for the total frontend throughput in MB/s.
•
Utilization: Select this metric type to view a report of the most active or the least active
LDEVs (or both) based on the threshold specified for the total RAID group utilization of
each LDEV.
•
Read Response Time: Select this metric type to view a report of the most active or the
least active LDEVs (or both) based on the threshold specified for the read response time
of each LDEV.
•
Write Response Time: Select this metric type to view a report of the most active or the
least active LDEVs (or both) based on the threshold specified for the write response time
of each LDEV.
3.
Provide the Metric Upper Threshold and Metric Lower Threshold limits. The threshold limits that
you specify are independent of each other and applicable to only the category that you select.
You can set both the maximum and the minimum threshold levels, or one of them based on
your requirement. It is not mandatory to specify both the maximum and minimum threshold
limits.
When you generate, save, or schedule this report, all the LDEVs that are above the specified
maximum threshold limit and below the minimum threshold limit are displayed in the report.
Creating report to view the most utilized RAID Groups
The RAID Group Utilization report provides data on the most utilized RAID groups in an XP or a
P9000 disk array. The utilization of each RAID group is derived based on the backend transfers
addressed by the RAID group and indicates the total utilization over an entire collection interval.
You can view the report for 8 - 32 busiest RAID groups and each chart in the report displays the
utilization graphs for eight RAID groups. To generate or schedule a RAID Group Utilization report,
follow the procedure given for creating or scheduling a report in
“Generating, saving, or scheduling
The report displays the utilization graphs for only those RAID groups that have managed the
backend transfers. When a RAID group is associated with a ThP pool, the extent of utilization due
to I/Os occurring on a ThP pool is considered.
304 Using reports
