High watermark in dashboard charts – HP XP Performance Advisor Software User Manual
Page 112

3.
Select the check box for the metric, for which you want to view the performance or usage
graph of the selected component, and click OK.
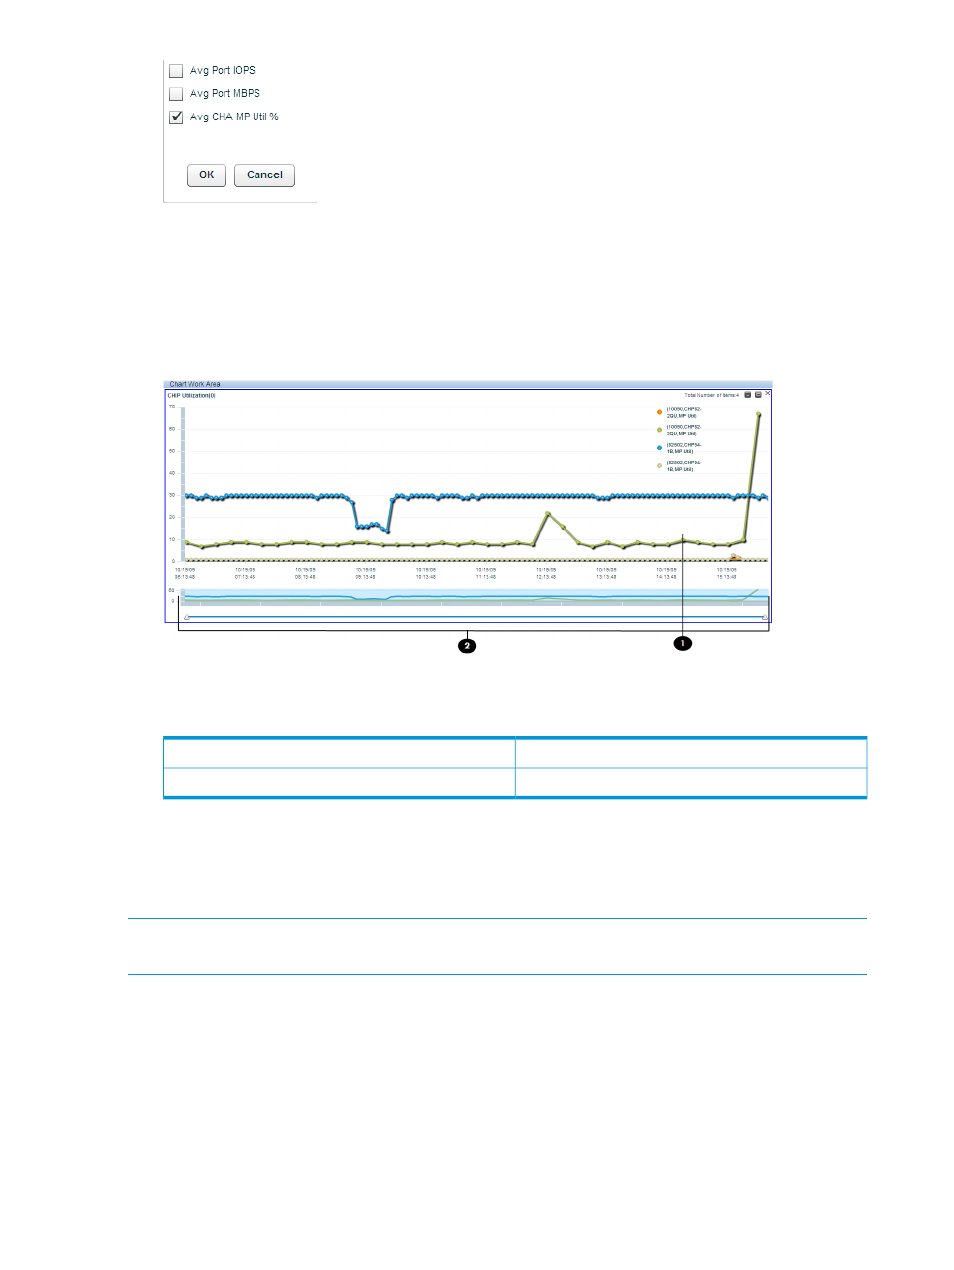
HP XP P9000 Performance Advisor plots the appropriate graphs in the Chart Work Area. The
duration for which the data points are plotted in the chart depends on the threshold duration
specified on the Threshold Setting screen. By default, the graphs are plotted for data points
collected in the last 6 hours of the management station's time.
The above image show the average CHA MP utilization graph plotted for CHPD4-2E that
belongs to the XP disk array 82502.
Chart window in the Chart Work Area.
1
Zoom Preview panel.
2
If you are plotting the port I/O metrics for a P9000 disk array, the port type is also displayed
beside the port ID in the chart legends.
After the graphs are plotted, use the chart options in the Chart Work Area to perform additional
activities on charts. For more information on using the chart options, see
NOTE:
All the charts in the dashboard screen is displayed for 1hour duration if the duration in
threshold settings is selected as Current.
High watermark in dashboard charts
Every chart in the Dashboard Chart Work Area section displays a high watermark. The high
watermark is an indication of the maximum average usage value of that component in the past
24 hours. High watermark is displayed after considering the usage data of a component in the
last 24 hours for a selected metric.
112
Monitoring performance of XP and P9000 disk arrays
