HP XP Performance Advisor Software User Manual
Page 115

Once the alarms are activated, you can view history for these alarms, which provides data on the
following:
•
When the performance of components went beyond or dropped below the set threshold limits
•
Time stamps of alarm notifications dispatched to the intended recipients
You can also view the corresponding performance graphs for components on which alarms are
generated. The following are the high level sequence of steps you must perform to activate alarms
and view history for configured alarms:
1.
Click PA and DB Settings+Configure Alarms in the left pane.
2.
Select components in the component selection tree under Data Source.
3.
Select the associated metrics for which the components must be monitored from the Available
Metrics Choose Metrics Category list. Click Add alarm(s) for the selected components to be
displayed in the Alarms table. The selected components can belong to an individual XP or a
P9000 disk array, or a custom group. For more information on selecting components and
metrics, see
“Adding or removing metric values” (page 116)
4.
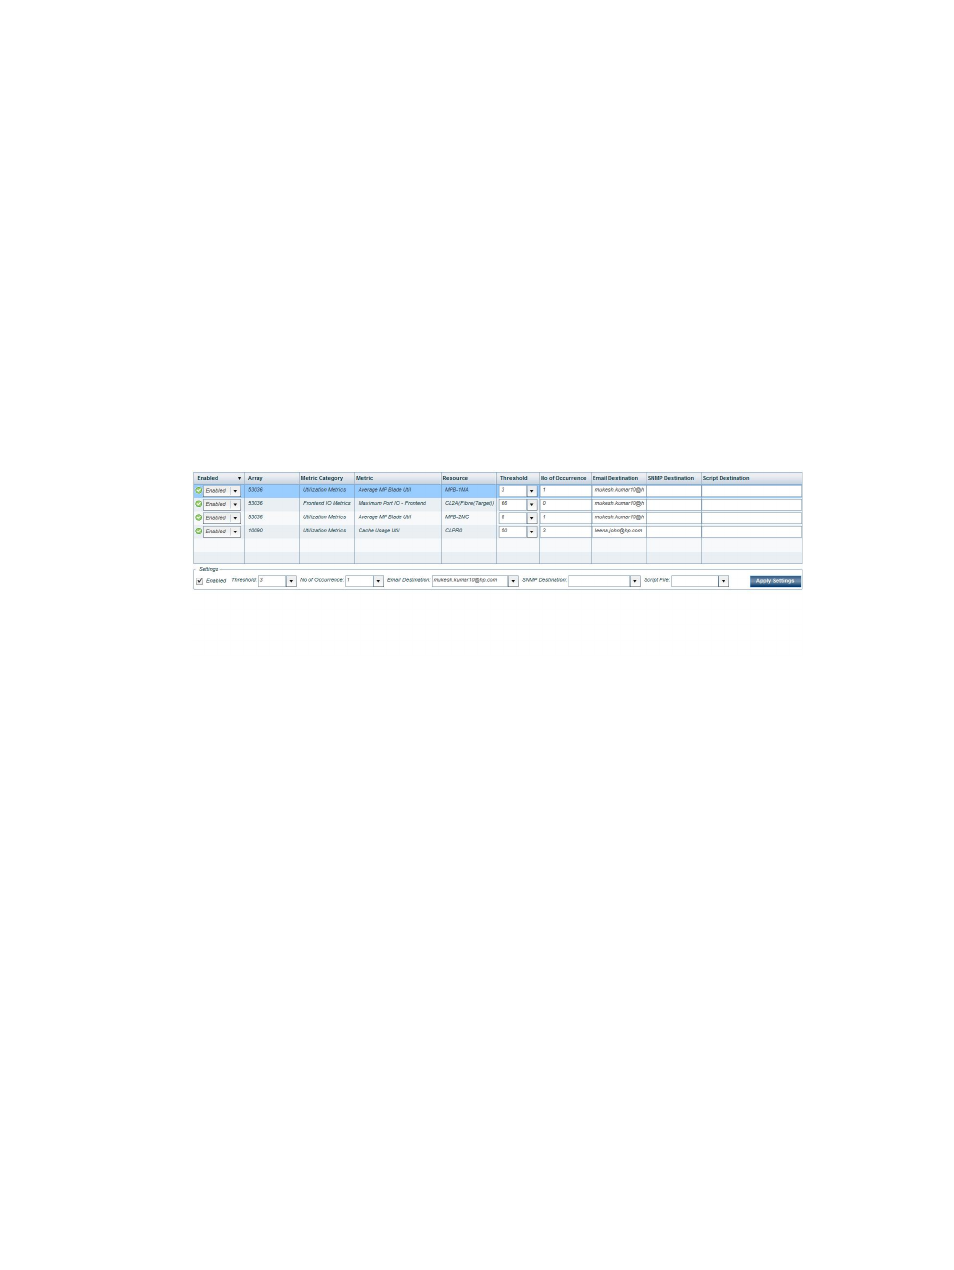
In the Alarms table, select an alarm record and configure threshold, number of occurrences,
alarm notification settings, and enable alarms on the components. For more information, see
“Configuring notification and monitoring settings” (page 117)
.
5.
After you enable alarms on components, HP XP P9000 Performance Advisor does the following:
a.
Collects the latest performance values of components in every collection frequency cycle
and compares them with the set threshold levels.
b.
HP XP P9000 Performance Advisor dispatches the appropriate alarm notifications, only
when the performance value of a component has exceeded threshold for the performance
cycles set as occurrence.
For example, while configuring the alarm if the user sets occurrence value as 2 for a
component, HP XP P9000 Performance Advisor dispatches a notification only when the
performance value of the metric remains above threshold for two consecutive performance
cycles. But any drop in performance value below the threshold post a serious alarm will
be immediately notified to the user.
HP XP P9000 Performance Advisor also displays the appropriate time for the
above-mentioned events under Time Posted, Time Updated, and Time Dispatched in the
Alarm History table. For more information, see
“Alarm History screen” (page 130)
.
c.
Logs a record for those components in the Alarm History table (see the following image)
(Monitoring+Alarm History). HP XP P9000 Performance Advisor starts logging records
from the subsequent data collection cycle when it starts monitoring the selected
components.
Introduction
115
