Creating an ldev activity report, Creating an – HP XP Performance Advisor Software User Manual
Page 303

frontend and eight backend LDEVs, and eight frontend and eight backend RAID groups. Further,
the report displays the graphs for only those LDEVs that have the associated I/Os and those RAID
groups on which the I/Os transactions have occurred.
Consider the following example: A report is created to view 32 busiest frontend LDEVs and 16
busiest frontend RAID groups, and only eight of the selected 32 LDEVs and four of the selected 16
RAID groups are busy. HP XP P9000 Performance Advisor generates the LDEV IO report where
you can view the graphs for only the eight LDEVs and four RAID groups on which the maximum
I/O transactions have occurred. The graphs are not shown for the remaining LDEVs or the RAID
groups. The LDEV IO report also provides a link to the additional LDEV IO mapping information.
The busiest LDEVs are displayed at different ranks in a tabular format. For more information, see
To generate or schedule an LDEV IO report, follow the procedure given for creating or scheduling
a report. For more information, see
“Generating, saving, or scheduling reports” (page 297)
. In
addition, ensure that the following steps specific to an LDEV IO report are also completed:
1.
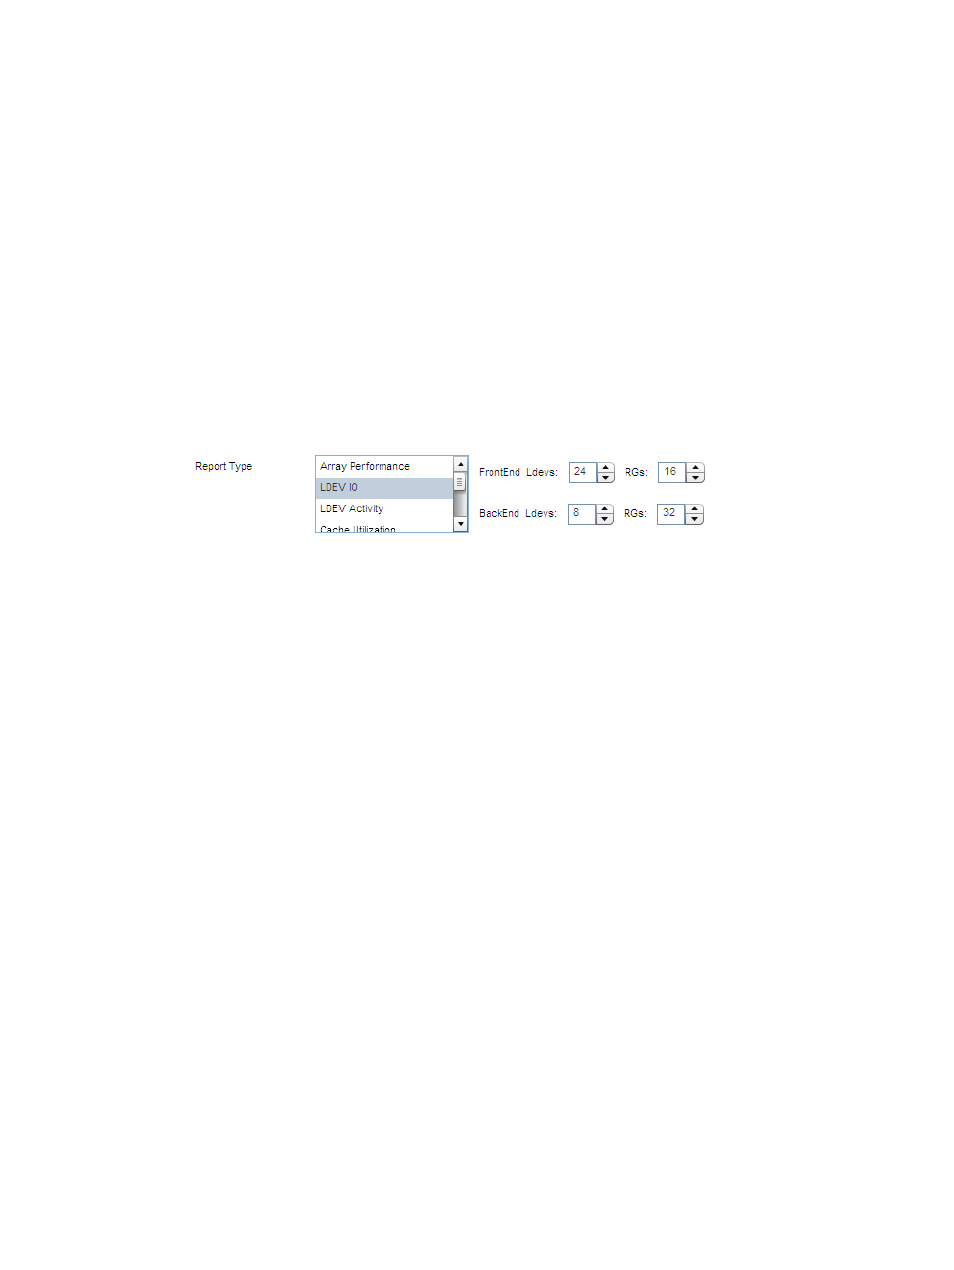
Select LDEV IO from the Report Type list.
2.
Select the LDEVs and the RAID groups based on the frontend I/Os and backend transfers from
the following lists:
•
LDEVs from the FrontEnd Ldevs list
•
LDEVs from the BackEnd Ldevs list
•
RAID groups from the FrontEnd RAIDGroups list
•
RAID groups from the BackEnd RAIDGroups list
Creating an LDEV Activity report
You can view the maximum and least busiest LDEVs in an XP or a P9000 disk array through the
LDEV Activity report. The LDEV data can be for one of the following metric types:
•
FontEndIO
•
BackEndIO
•
MB
•
Utilization
•
Read Response Time
•
Write Response Time
The maximum and least busiest LDEVs are collated based on the maximum and minimum threshold
levels you specify, and also the metric type that you select. For the metric type and duration that
you specify, the average of the total performance of each LDEV is considered. Further, the average
value is verified with the set threshold levels to see if that particular LDEV's performance is above
or below the threshold limit. Based on their average values, the LDEVs are grouped in the top 100
busiest or the least 100 busiest LDEVs, and displayed in the CSV file. It implies that only those
LDEVs that are above the maximum and below the minimum set threshold limits are considered.
The associated driver type is also displayed for each LDEV. This information helps you to identify
if the associated drive is supporting the required LDEV performance. If not, move the LDEV to a
different drive type.
To generate, save, or schedule an LDEV Activity report, follow the procedure given for creating or
scheduling a report. For more information, see
“Generating, saving, or scheduling reports”
Creating an LDEV Activity report 303
