Figure 28 - normal memory depth, Figure 29 - long memory depth – B&K Precision 2516 - Manual User Manual
Page 58
58
4.
Now, go back to Horizon menu and change MemDepth to Long
Mem. Go back to Acquire menu afterwards and note the Sa Rate is
now 100.0MSa.
5.
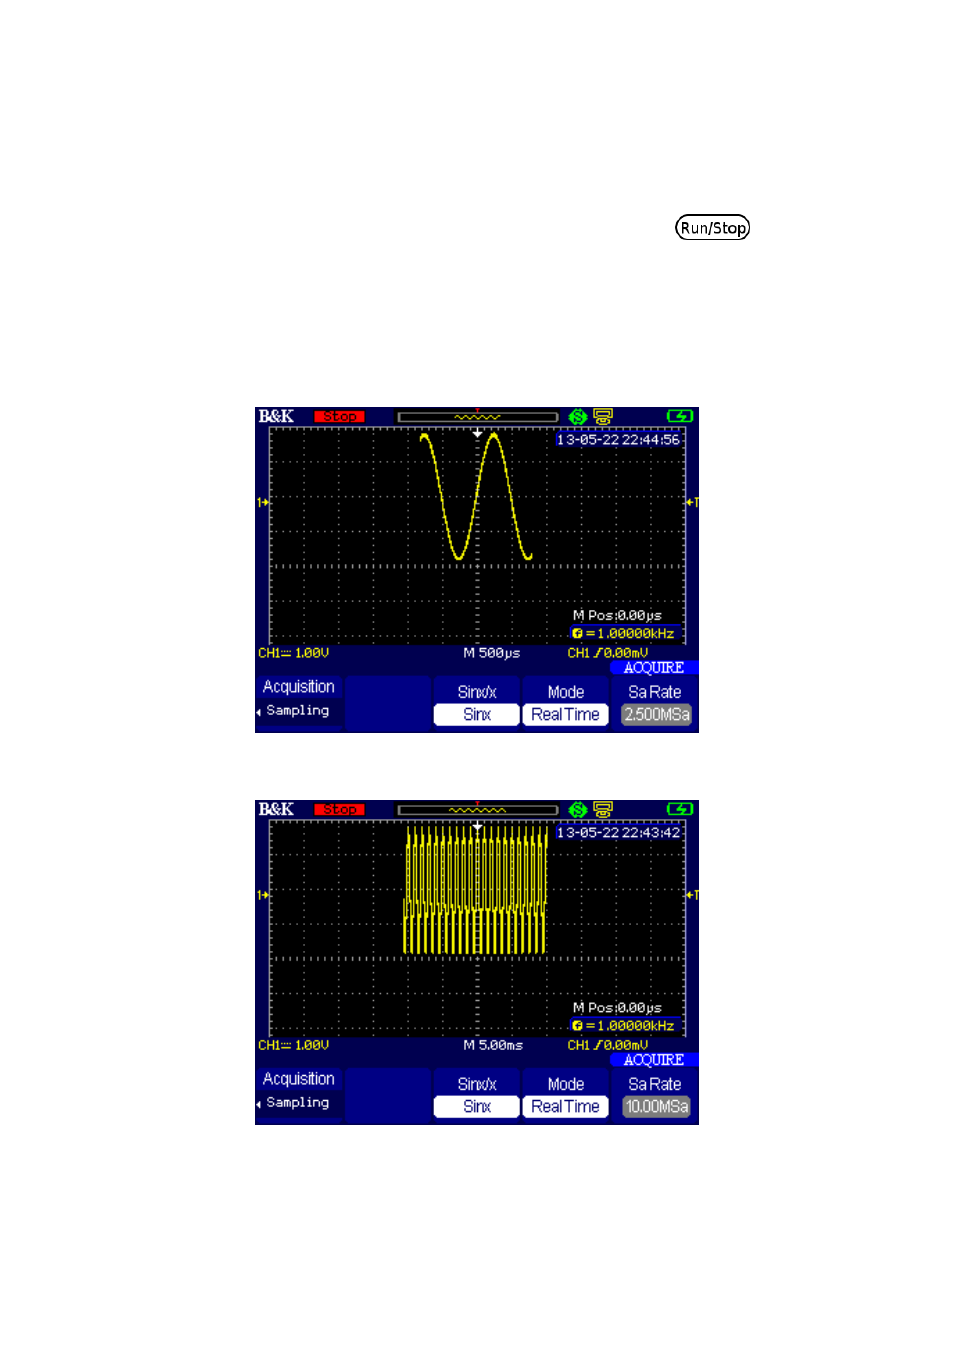
The differences can be visually observed by pressing
to stop
the waveform at 100 µs. Then adjust the horizontal scale factor to a
slower timebase until the entire waveform captured can be shown
on the display.
6.
Observe with both MemDepth set to Normal and Long Mem.
7.
Below is an example between the two captured at 100 µs timebase.
Figure 28 - Normal Memory Depth
Figure 29 - Long Memory Depth
This manual is related to the following products: