English – Milwaukee M12 TI User Manual
Page 3
4
5
button. The figure shows a thermal image with some SPOT
METER and IMAGE NOTE annotations added.
ANALYZE IMAGES TOOLS
Each tool is described next. You can move back to the ANALYZE
IMAGES step at any time to make further adjustments, even after
you have created a report.
NOTE: You can delete any notation you make on an image by
selecting it with the mouse and clicking the x to delete it.
Image Selection Toolbar:
Thumbnail images are located on the left side of the screen.
Choose an image to analyze by clicking on a thumbnail image
here, or by clicking the < BACK or > NEXT button.
Analyze Tools:
SHOW EDITS: Toggles between displaying and hiding the edit
notes you have applied to images. When you hide them, they are
still there for the report, but they are just temporarily hidden from
view. You might want to hide edits momentarily in order to see
what is under a note.
SPOT METER: Use this tool and move the mouse to read the
temperature at any point in a thermal image. Left-click to insert a
SPOT METER mark and its associated temperature reading on an
image.
AREA METER: Use this tool to detect and show the average
temperature in an area. Move the mouse to a corner of the area
you want to select, then click and hold down the left mouse button
while you draw a box around the desired area. The Average, High
and Low temperatures in the selected area inside the box appear
in the Notes Area to the lower right. The ^ mark indicates the
highest temperature in the area. The
v
mark indicates the lowest
temperature in the area.
See figure
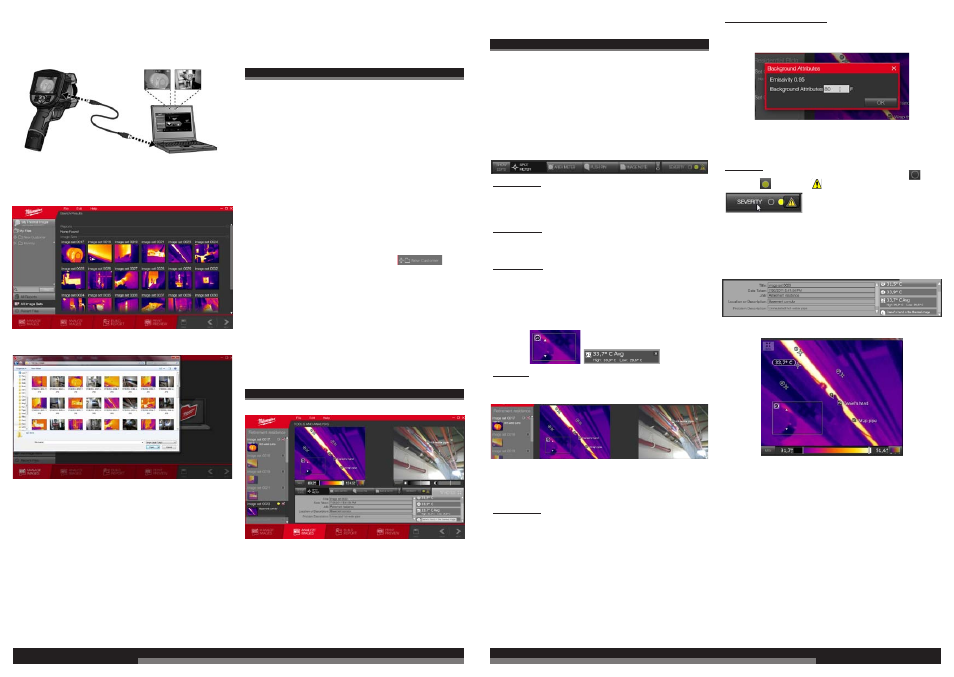
PUSH PIN: Use the PUSH PIN to mark a spot and make a
comment about the spot. The comment appears in the notes area
below the image, and is included in the report. An example is in
figure below:
where it says “Daniel’s hand in the thermal image.” It is easy to see
the arm and hand in the visual image, but hard to find the arm and
hand in the thermal image. The user made this note to help the
person receiving the report find the arm and hand pointing to a
specific pipe.
IMAGE NOTE: Use this tool to write a very short note on an
image. These notes do appear in the report.
Method 2:
Remove the SD card from the Thermal Imager and load images
from the SD card directly into the computer using the USB SD
Card Reader or an SD socket if your computer has one.
The following figure shows what the computer screen looks like
when you use LOAD FROM THERMAL IMAGER. The only time
you use LOAD FROM ANOTHER SOURCE is if you are loading
images that are already on your computer’s main storage drive, on
a CD-ROM, or a USB thumb drive.
The following figure shows a typical Windows file browsing screen
you see when you use with LOAD FROM ANOTHER SOURCE.
NOTE: When you manually load images using LOAD FROM
ANOTHER SOURCE, you must make sure to always load both the
thermal and visual image to get a complete image set, or the
Software will not work properly.
When the Software finds images, you then use the check boxes to
select either all images or individual images. To choose just a few
images for a job, proceed as follows:
1. Click on Include All once or twice as needed to un-check all
images. Include All toggles between all-checked and
all-unchecked. Verify that all the check marks are gone.
2. Click on the image check-boxes to put a check mark in the ones
you want.
3. Click on SAVE on the bottom taskbar.
NOTE: The recommended practice is to first load all images from
the Thermal Imager or SD card that have not already been loaded
into the Software. Later, you can choose which images you want to
include in a Job and Report.
NOTE: The Software auto-saves your work every 2 minutes by
default. You can change the File Saving setting in the top-level File
menu under Settings.
PREPARING TO ANALYZE IMAGES
Before you can start analyzing thermal images you have loaded
into the Software, you must first start a new Job, or open an
existing Job. Previously saved Jobs are listed in the gray area on
the left panel of the screen. The most convenient way to start a
new Job is to start downloading images from the Thermal Imager,
and follow the prompts to start a new Customer and a new Job. If
there are existing Customers and Jobs, you will be prompted to
select one of those, or start a new one.
NOTE: The term “Job” means a package of images that you have
selected, annotated and adjusted. The Software automatically
formats the job into a report. For later Software work sessions, you
can open a previous Job and resume work on it, or you can start a
new Job.
NOTE: The term “Customer” means an entry in the Software’s
internal database for the name of a customer.
To start a new Job, proceed as follows:
1. You can start a new Job under an existing Customer name, or
you can create a new Customer first. To start at the beginning
with a new Customer, move the mouse over
and
click on it to start entering the name of the New Customer, then
click on Create New Customer.
2. Click on New Job. Type in the name you want for the new Job
and click on Create New Job.
3. Click on All Image Sets to choose images from all the images
saved so far. This selection is located in the lower left side of the
screen, just under the list of Jobs.
4. Choose images for your report by Group (if there have been
some Groups saved), by “all,” or individually using the check
boxes on each image you want to include. Images are saved in
a new Group in the Thermal Imager when more than 12 hours
have passed since saving a new image. This is for your
convenience for when you load images onto a computer.
ANALYZING A THERMAL IMAGE
In this step you prepare your images for the report.
Using the ANALYZE IMAGES tools, you can direct attention to
something in an image and explain in your own words the
significance of the temperatures detected and displayed in the
image. You can mark spot temperatures, change the color palette,
and insert various tags and remarks. Click on ANALYZE IMAGES
on the bottom menu bar or, if you are in the MANAGE IMAGES
step, click on the > NEXT button to move to this step.
Choose an image to analyze by clicking on a thumbnail image on
the left side of the screen, or by clicking the < BACK or > NEXT
ENGLISH
ENGLISH
BACKGROUND ATTRIBUTES: Use this tool to apply a correction
factor to temperature readings to compensate for reflected infrared
energy that is radiated from adjacent objects outside the image
area. See below for an example setting.
NOTE: You need this feature only in extreme cases where you
need the very best possible accuracy in temperature readings. It
does not help in revealing differences in temperatures, which is
mainly what is required for troubleshooting.
SEVERITY: Use this tool to place an icon on an image indicating
the importance of the thermal image in three levels: LOW
CAUTION
and ALERT .
Notes Bar:
This part of the screen shows all the IMAGE NOTES and SPOT
METERs you have inserted, as well as the optional descriptions for
the image. You can hide the notes bar by clicking on the
expand-contract toggle icon located above and to the right of the
notes bar. Click it again to bring back the notes bar. Hiding the
notes bar gives you a bigger workspace for analyzing images.
The following figure shows a thermal image that has been
annotated using all the tools.
Range and Color Palette Adjustments: Change the Range and
the color palette if desired using the tools at the bottom of the
thermal image display. You can safely experiment with different
settings. The data stored in the files from the Thermal Imager are
not erased when you make adjustments to images.