3 statistical calculations, Statistical calculations – Casio ClassPad II fx-CP400 User Manual
Page 237
Chapter 13: Spreadsheet Application
237
u To show or hide lines and markers for a line graph or a scatter graph
1. While a line graph or a scatter graph is on the Graph window, tap the [View] menu.
2. Tap the [Markers] or [Lines] item to toggle it between show (check
box selected) and hide (check box
cleared).
• Line and scatter graphs can have markers only, lines only, or both markers and lines. You cannot turn off
both markers and lines at the same time.
13-3
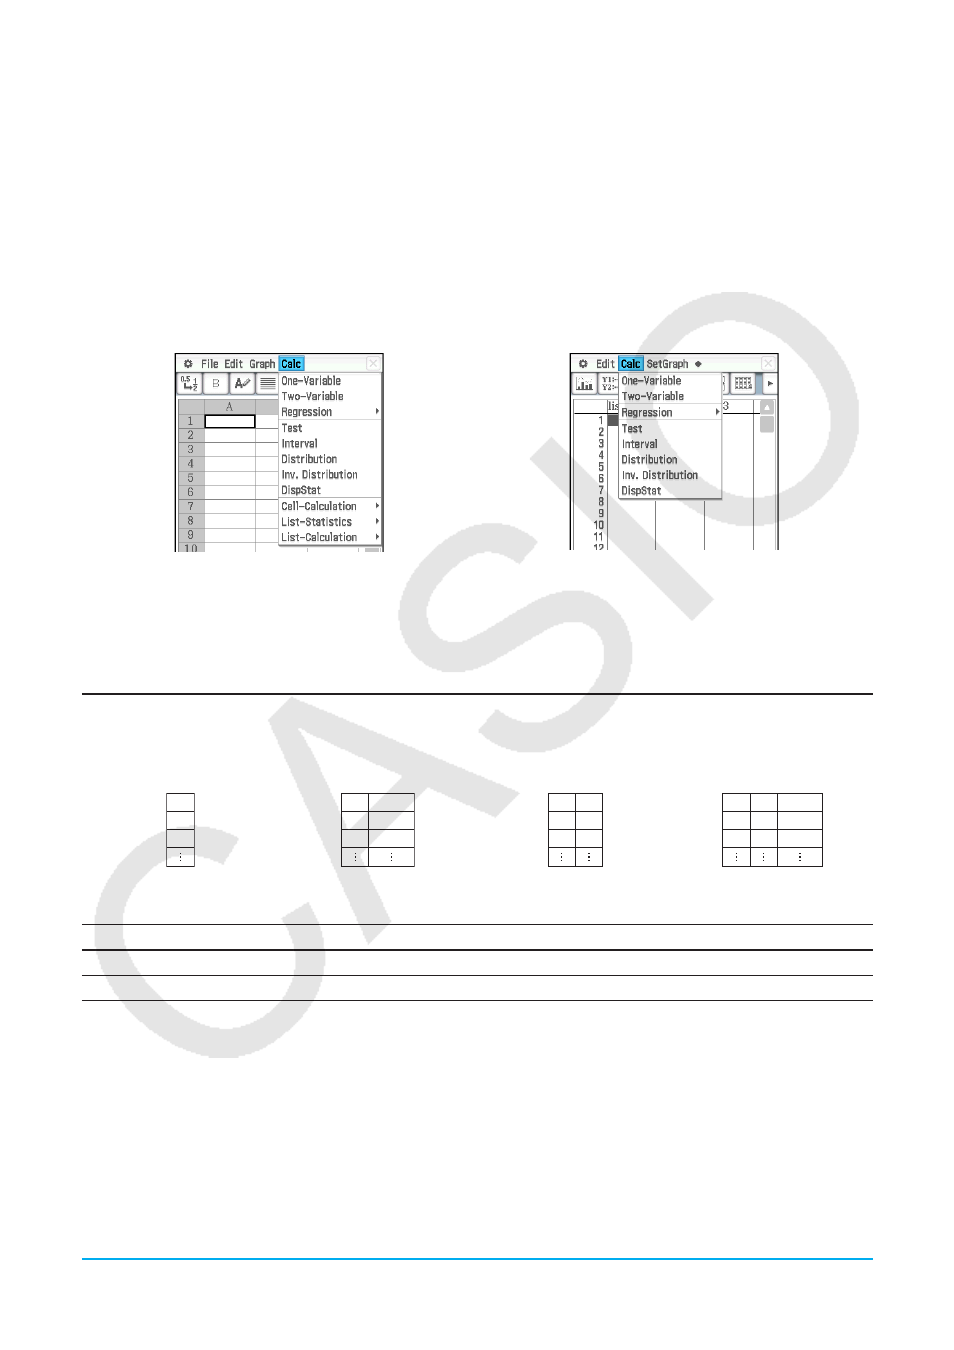
Statistical Calculations
The upper part of the [Calc] menu includes the same menu items as the Statistics Application [Calc] menu.
Spreadsheet Application
Statistics Application
Menu items with the same name perform the same functions, but there are some differences between the
Statistics Application and Spreadsheet Application in terms of operation procedures, calculation result display,
etc. This section explains statistical operations and functions that are peculiar to the Spreadsheet Application.
Single-variable, Paired-variable and Regression Calculations
When performing these calculations, you need to prepare data of one of the formats shown below.
(a)
(b)
(c)
(d)
X1
X2
X3
X1
X2
X3
Freq 1
Freq 2
Freq 3
X1
X2
X3
Y1
Y2
Y3
X1
X2
X3
Y1
Y2
Y3
Freq 1
Freq 2
Freq 3
Single-variable Data
Single-variable Data
with Frequencies
Paired-variable Data
Paired-variable Data
with Frequencies
To perform this type of calculation:
Prepare this type of data:
Single-variable calculations
(a) or (b)
Paired-variable and regression calculations
(c) or (d)
For any of the above calculations, selecting a command displays a wizard screen. The example below shows
how to perform a regression calculation.