8 creating a chart in excel – SMA Sunny Data Control V.4.2 User Manual
Page 121
SMA
Technologie AG
Managing Data and Saving Data Locally
User Manual
SDC-TEN080642
Page 121
11. 8 Creating a Chart in Excel
Your recorded measured values in Excel format can easily be analyzed graphically
with Excel. The data are also automatically visualized in a chart.
To this end, there are two options, which are described in the next sections.
•
Automatic analysis:
The analysis is started via Sunny Data Control. Excel opens automatically with the
data analysis macro.
•
Manual analysis:
Manual analysis is only required if you wish to start the analysis on a PC on which
Sunny Data Control is not installed. The analysis is then started directly from Excel,
and the macro is executed manually.
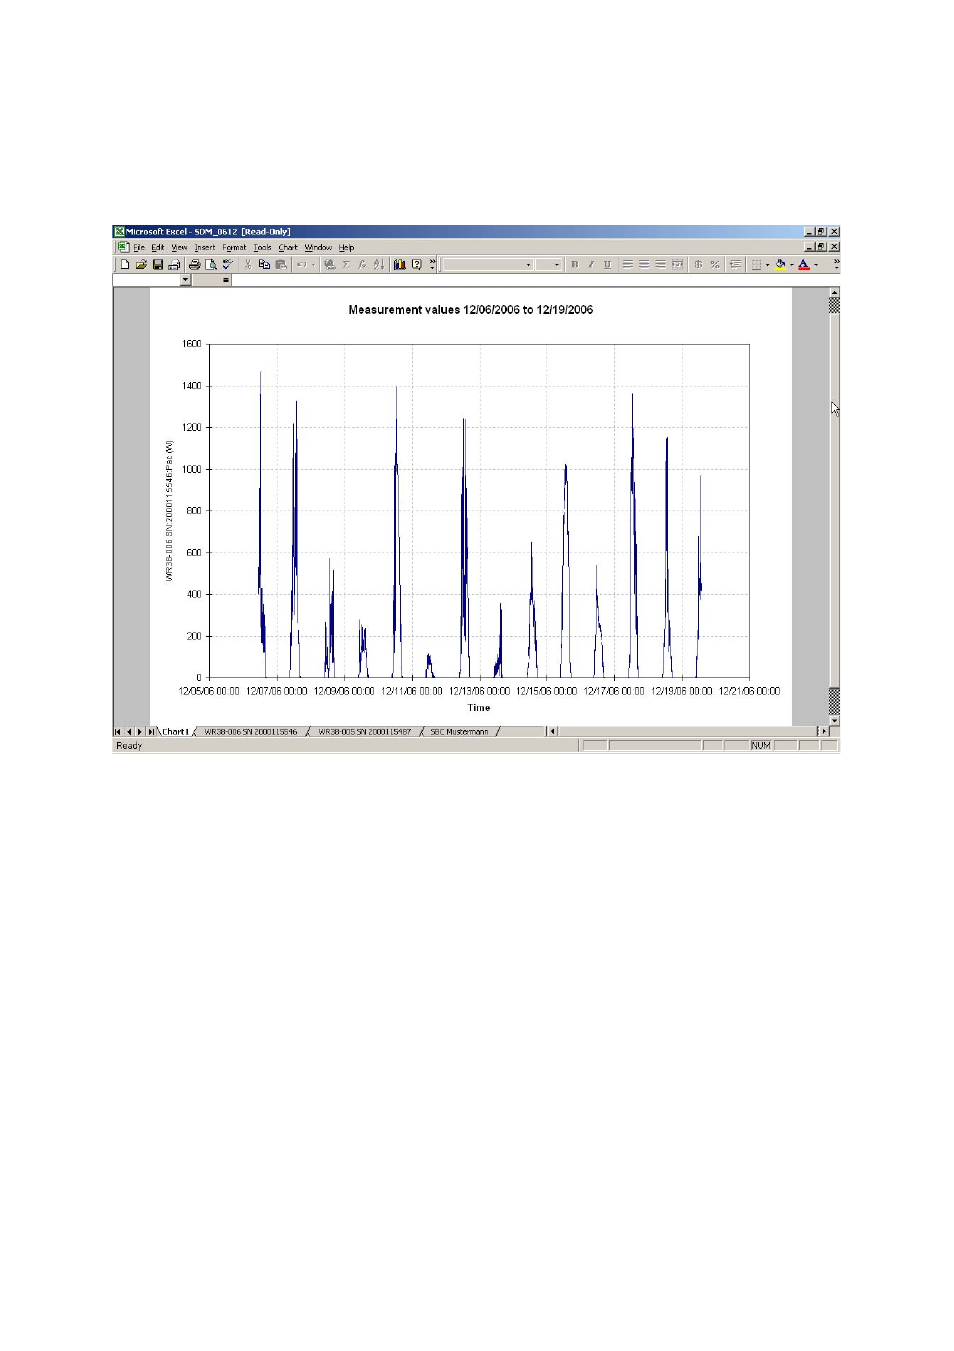
Example chart
See also other documents in the category SMA Equipment:
- SUNNY PORTAL (75 pages)
- SB 2.5-1VL-40 (60 pages)
- SB 2.5-1VL-40 Service Manual (36 pages)
- SB 240 (78 pages)
- FLX Pro 17 (12 pages)
- FLX Series GSM Option Kit (48 pages)
- FLX Series Sensor Interface Option (51 pages)
- FLX Series PLA Option (62 pages)
- FLX Series (248 pages)
- 25000TL (52 pages)
- 25000TL Installation (40 pages)
- 25000TL Service Manual (46 pages)
- CBL-DC-CMB8-10 (24 pages)
- 25000TL Quick Installation Guide (36 pages)
- STP 60-10 Replacing a Defective Fan (12 pages)
- STP 60-10 Replacing Defective Surge Arresters (12 pages)
- Webconnect Systems in SUNNY PORTAL (69 pages)
- STP 12000TL (68 pages)
- STP 60-US-10 Installation (232 pages)
- 485 Data Module Type B (24 pages)
- STP 12000TL Quick Installation Guide (28 pages)
- 1000-US (52 pages)
- STP 24000TL-US (78 pages)
- STP 20000TL (2 pages)
- STP 17000TL (60 pages)
- SB 6000TL Service Manual (46 pages)
- MULTIFUNCTION RELAY (32 pages)
- SB 5000TL (60 pages)
- SB 5000TL Quick Installation Guide (32 pages)
- FANKIT01-10 (24 pages)
- SB 7700TL-US (28 pages)
- FANKIT02-10 (24 pages)
- SB 7700TL-US Installation (96 pages)
- SUNNY MINI CENTRAL (48 pages)
- DC Disconnect Switch For SB 3800-U (32 pages)
- SB 4000-US (100 pages)
- DB-DC-DISCON (4 pages)
- SB 3800-U (86 pages)
- POWER BALANCER (28 pages)
- SB 8000-US (104 pages)
- SB 11000TL‑US (40 pages)
- SMC 11000TL (24 pages)
- SBCBTL6 (36 pages)
- SB 11000TL‑US Installation (92 pages)
- SMC 11000TL Installation (96 pages)