Inserting a chart/changing the chart type – Turning Technologies TurningPoint 5 User Manual
Page 80
TurningPoint 5 for PC
80
Office 2003
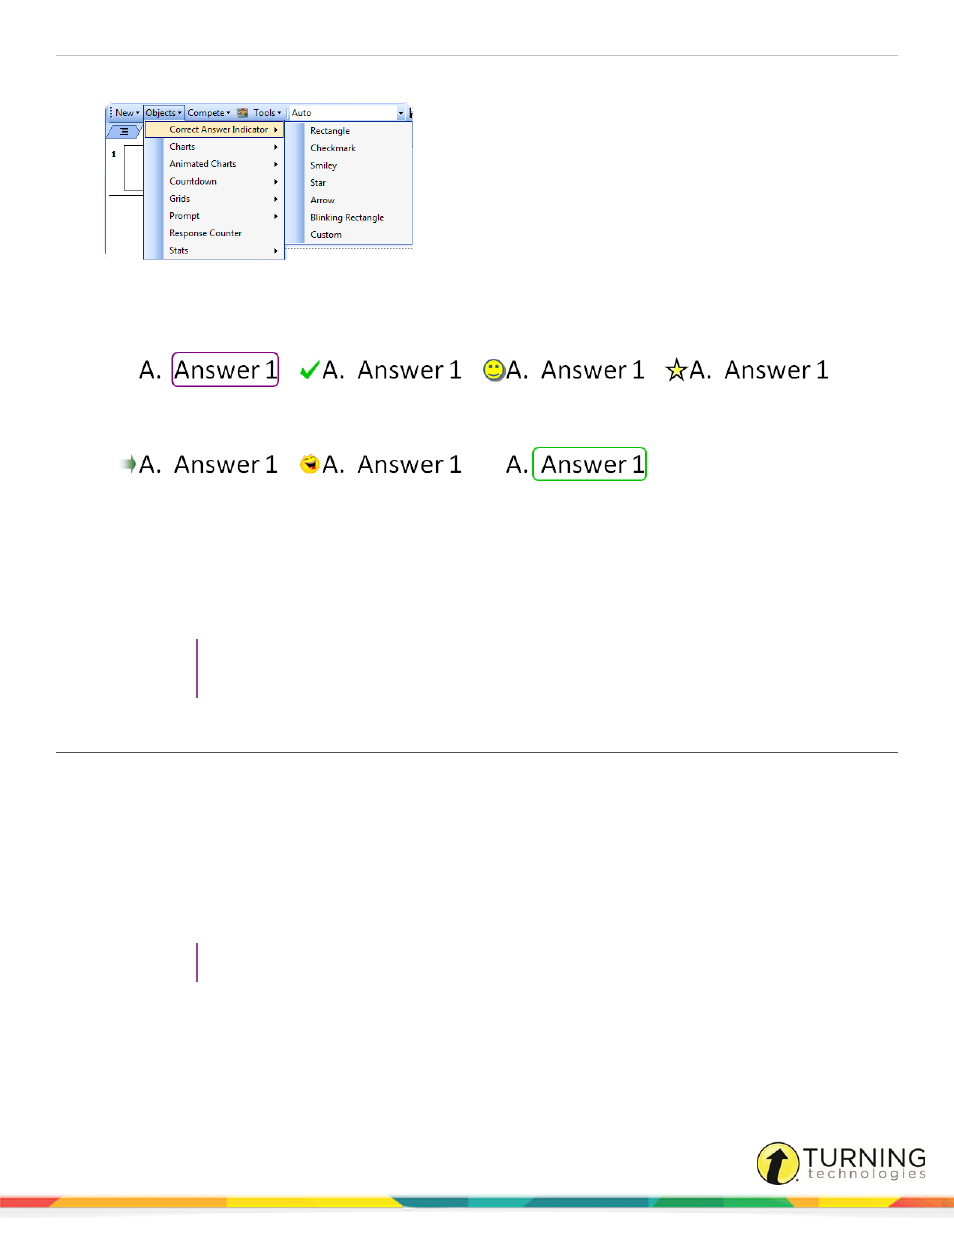
There are seven types of correct answer indicators available.
Rectangle
Checkmark
Smiley
Star
Arrow
Custom
Blinking Rectangle
l
A custom answer indicator can be a BMP, JPG, GIF, PNG or JPEG file. The image is placed in the same
location as the checkmark, smiley, star and arrow correct answer indicators.
l
Select a different correct answer indicator from the Objects menu to change the current correct answer indicator
on the slide.
l
To remove the correct answer indicator, simply delete the object from the slide.
TIP
Correct answer indicators can be formatted like regular PowerPoint objects. Right-click on the
object and select a formatting option from the menu.
Inserting a Chart/Changing the Chart Type
A chart displays the results of participant responses. The default chart type and display options, such as colors, labels and
value, can be defined in the Preferences. For more information on how to set a default chart type, see
Prerequisites
To make a PowerPoint slide interactive, a TurningPoint chart must be added to the slide. Assuming that the PowerPoint slide
is in Title and Content form, a chart can be added by following the steps below.
1
Select the polling slide.
TIP
Select more than one slide by holding down the Ctrl or Shift key on the keyboard.
turningtechnologies.com/user-guides