Calibration formulae, O_463, O_604 – BUCHI DuMaster D-480 User Manual
Page 55: O_2036
Operation Manual D-480
©BÜCH Labortechnik AG
4 - Understanding the instrument and planning its use
55
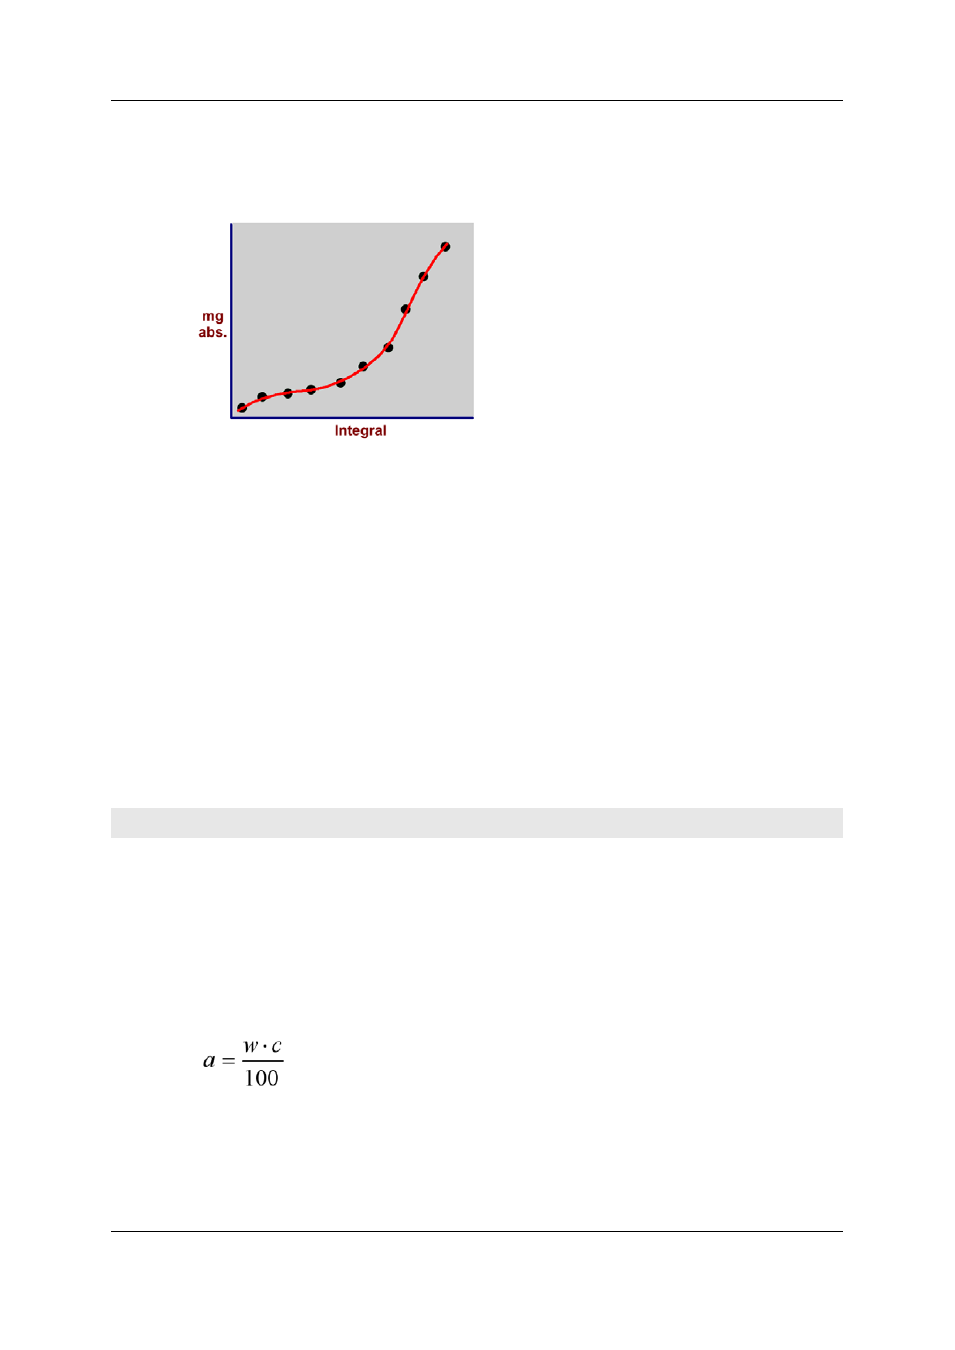
Polynomial calculation over the whole range
The following picture shows an example in which a polynomial calculation over the whole range
achieves acceptable calibration curve quality.
Achievable calibration curve quality
Process standard deviation "Proc-SD" and quality factor "r" serve as a measure of achievable
calibration curve quality.
Use the following values for process standard deviation "Proc-SD" as guidelines:
Acceptable value:
Proc-SD = ±3 µg in the lower range
Proc-SD = ±15 µg in the upper range
Very good value:
Proc-SD = ±1 µg
Use the following values for quality factor "r" as guidelines:
Good value for linear calibration function:
r = 0.99 (r should tend to 1)
Good value for polynomial as calibration function
r = < 2-4 (r should tend to 0)
If you do not approximately achieve the listed values you can assume that you have chosen the
wrong calibration curve calculation method.
Calibration formulae
Calculation of absolute element content
Calibration is performed by analyzing samples with known concentrations (standard samples) in
which the measured peak areas are correlated with the corresponding absolute element content.
For a standard sample, the following parameters are known:
element concentration
Weight
Absolute element content is computed according to this formula:
where:
a = absolute element content in [mg]
w = sample weight in [mg]
c = element concentration in [%]