H_824, O_827, H_826 – BUCHI DuMaster D-480 User Manual
Page 180
Operation Manual D-480
©BÜCH Labortechnik AG
8 - Maintaining the instrument
180
Click OK to save your settings and close the dialog. The "Specify lower and upper calibration
range" dialog appears. It displays a graph generated from the absolute contents of the samples
and their peak areas in a linear calculation. The graph displays deviations of the measuring
points from these lines.
Observe the measuring points and decide
what calculation would be suitable
whether you would separate the the ranges
and, if so, where you would separate the ranges.
See Calibration curve calculation method criteria (on page 53).
Write down your considerations.
Click OK to view the readings for the other elements. For each element, decide as described
before.
Write down your considerations.
Click Cancel.
Phase 3: Set calculation methods, perform calculation
Proceed as follows:
Execute the following command again: Math. > Calibration. If sequential blank value
determination is activated a message window opens showing the corresponding information.
Click Yes to continue. The "Configure calibration" dialog appears.
Define the settings that you ascertained in the preceding phase.
Click OK to save your settings and close the dialog.
If you have decided to split the calibration into a lower and an upper range the "Specify lower and
upper calibration range" dialog appears. Set the dividing line by clicking the < and > buttons and
then click OK.
First, the calibration curve for the lower range appears in the calibration view.
Phase 4: Optimizing calibration curves and apply calibration
Background information can be found in Assessing the calibration curves (on page 182).
In order to optimize the calibration curve for each element you must exclude samples that deviate
significantly from the curve. Deviations of up to ± 1.3 µg are tolerable.
Proceed as follows:
Zoom in/out the graph by selecting View > Zoom in/out so that you can check the overall curve.
Click the
and
buttons to move from sample to sample in the calibration curve and
check the deviation "Diff.". Samples that display excessive deviation must be deleted.
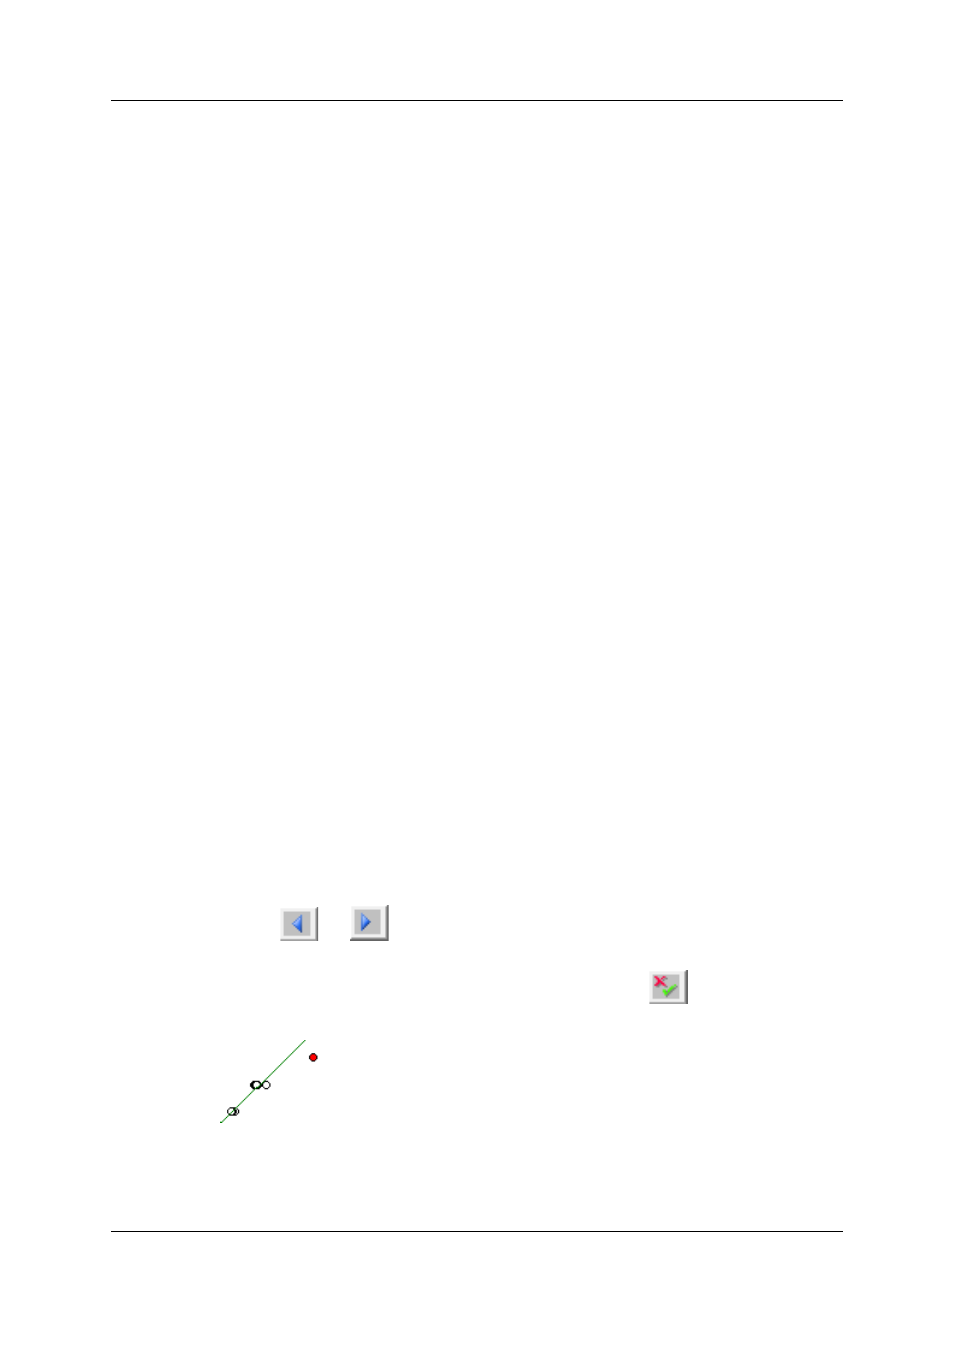
Select a sample to delete. Then click the "Include/Exclude" button"
. The deleted sample is
highlighted red.
Compare "r" (new value) and "r_old" (old value) of the calibration curve and check whether
deleting has had the desired effect. See Assessing the calibration curves (on page 182).