Setting the graph display, Figure 31 setting the graph display, Set and activate acceptance limits – Bird Technologies SA-6000XT-Manual User Manual
Page 53
37
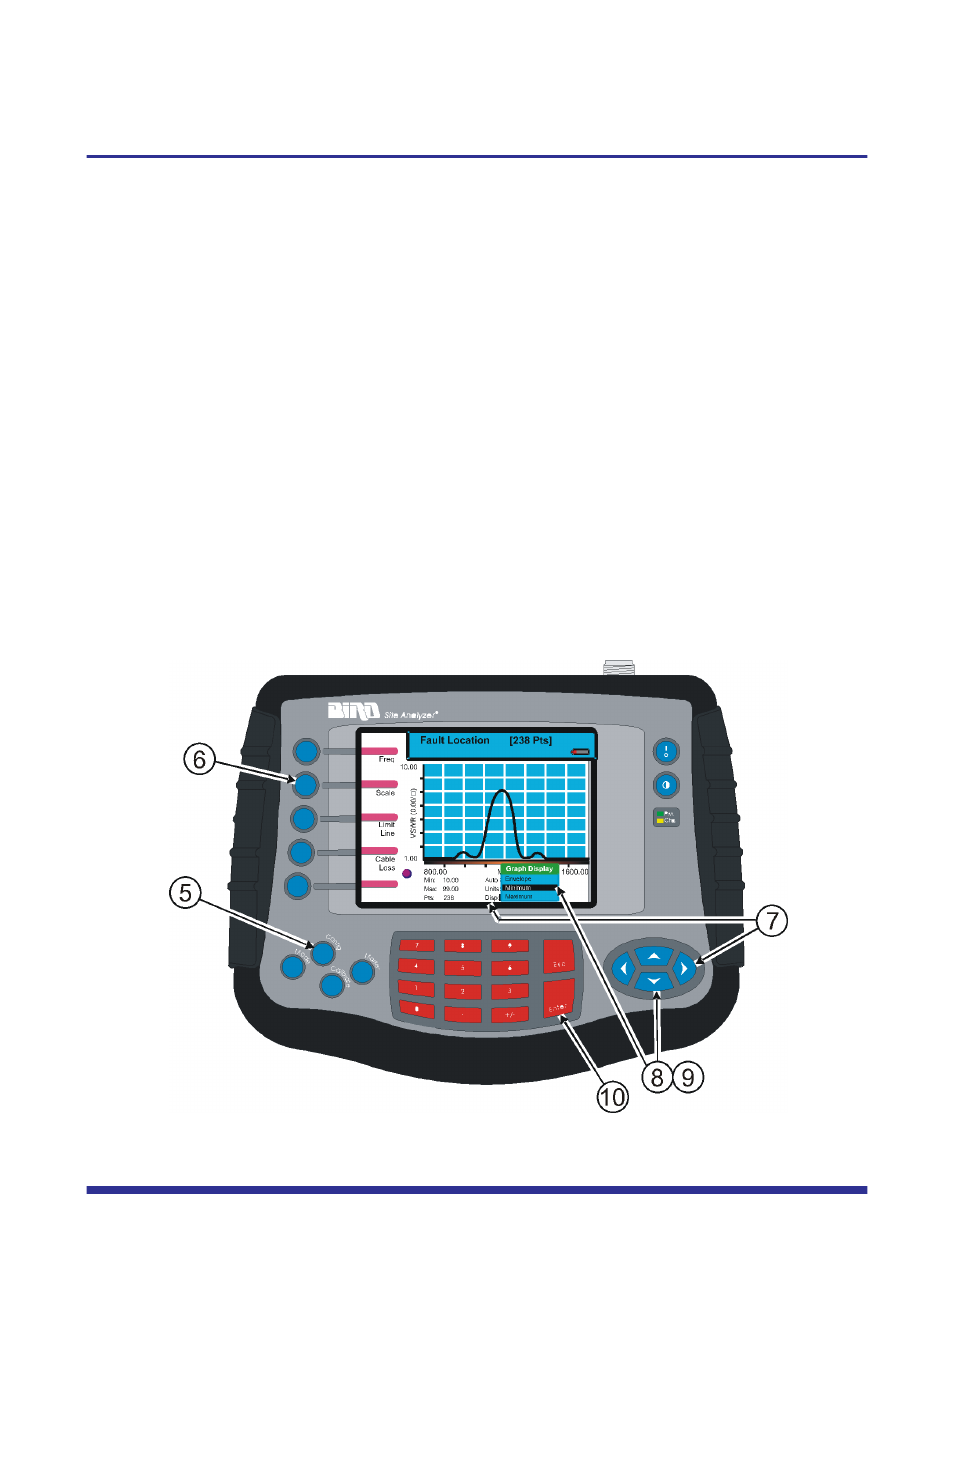
Setting the Graph Display
1.
Enable the Measure Match Mode. See “Selecting the Measure Match
Mode” on page 13.
2.
Set the frequency. See “Setting the Measurement Frequency” on page 14.
3.
Calibrate the Site Analyzer. See “Calibration” on page 11.
4.
Enable the Fault Location Mode. See “Selecting Fault Location Mode” on
page 26.
5.
Press the Config key.
6.
Press the Scale softkey.
7.
Press the left or right scroll key to select Disp.
8.
Press the up scroll key to open the selection list.
9.
Press the up or down scroll key to select a display type (envelope, maxi-
mum, minimum).
10. Press the Enter key to accept the selection and return to the configuration
screen.
Figure 31 Setting the Graph Display
Set and Activate Acceptance Limits
The limit line helps to set off those parts of a trace that are outside of the accep-
tance (limit) values. It appears as a horizontal line at the limit line value.
An acceptance limit line can be set to help visualize what part of the measure-
ment trace is not acceptable. The part of the trace that is not acceptable will dis-
play in red. To view the limit line, the limit test must be ON. This feature is
available only in the Measure Match mode and the Fault Location mode.