Figure 15 setting the graph display, Set and activate acceptance limits, Measure the match of the component – Bird Technologies SA-6000XT-Manual User Manual
Page 35
19
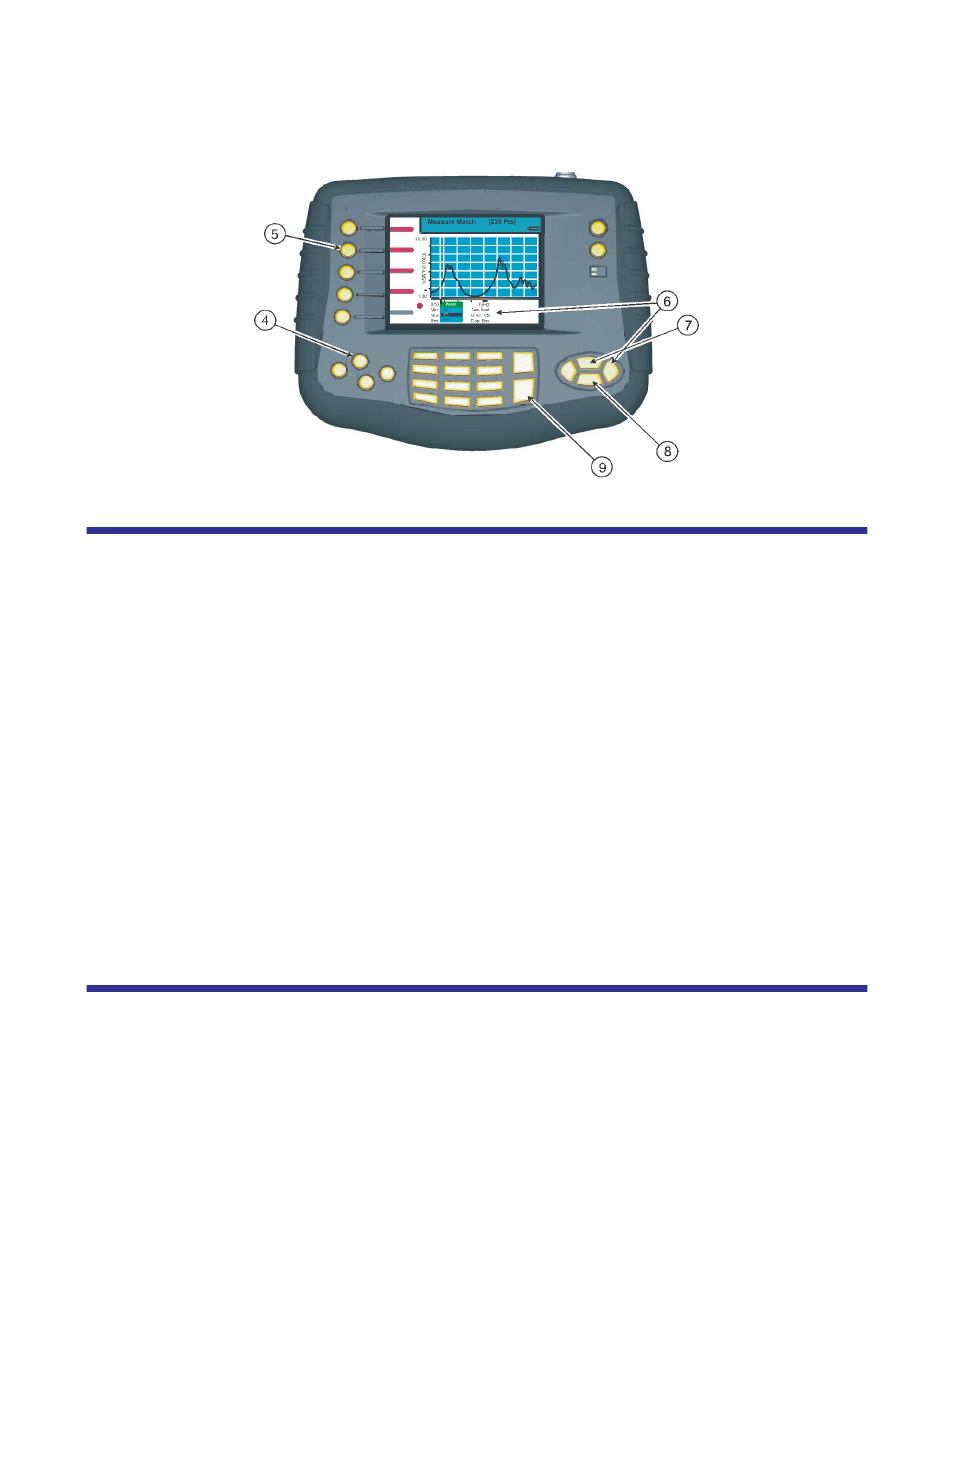
Figure 15 Setting the Graph Display
Set and Activate Acceptance Limits
The limit line helps see failures. It appears as a horizontal line at the value
selected.
An acceptance limit line can be set to help visualize what part of the measure-
ment trace is not acceptable. The part of the trace that is not acceptable will dis-
play in red. To view the limit line, the limit test must be ON. This feature is
available only in the Measure Match mode and the Fault Location mode.
1.
Enable the Measure Match Mode. See “Selecting the Measure Match
2.
Set the frequency. See “Setting the Measurement Frequency” on page 14.
3.
Calibrate the Site Analyzer. See “Calibration” on page 11.
4.
Follow the numbered steps in Figure 46, page 51 to turn ON the limit test
and set the limit line value.
Note: When setting a limit line value with the Limit Test turned OFF,
a line will not be displayed on the screen.
Measure the Match of the Component
1.
Connect the Site Analyzer to the component being tested as follows:
Antenna – (if used) Connect the Phase Stable Cable directly to the
coaxial connector of the antenna. There should be no other transmis-
sion lines or jumpers connected.
Other Components – (Including Jumpers, Transmission Lines, Light-
ning Protectors, and RF Filters) Connect the Phase Stable Cable to one
end of the component. Connect the Calibration Combination Load to the
other end of the component.
2.
Wait at least 10 seconds for the sweep to update.
3.
When a trace is displayed on the screen, any of the following can be done:
Hold the trace. See “Measurement Hold” on page 51.
Add markers to the trace. See “Markers” on page 52.
Save the trace. See “Saving a Trace” on page 58.