Step 7: enter the chart title, Step 8: filter the data – Rockwell Automation FactoryTalk Metrics User Guide User Manual
Page 190
Chapter 5 Analyzing FactoryTalk Metrics Data
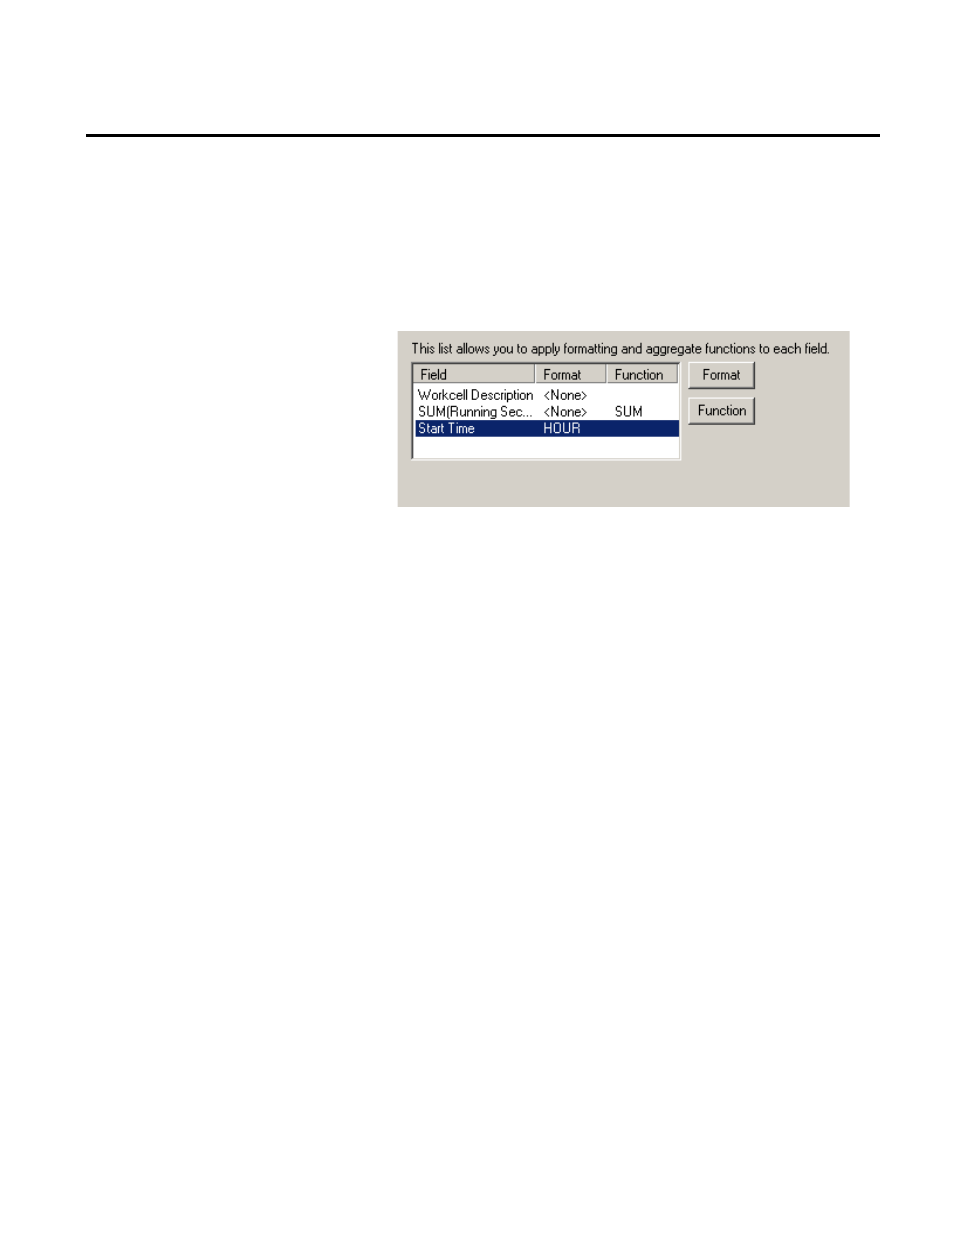
workcells by hour. From the X-Axis list, select Start Time.
Start Time is added to the list at the bottom of the dialog box.
5. To show the hour, you will need to apply the HOUR format
to the field. Click the Start Time field in the list, click the
Format button, and then select HOUR from the menu.
6. Click Next to continue.
To enter the chart title:
1. The Report Object Name dialog box appears. You must
provide a unique name for the report object. The name you
enter here will appear at the top of your new chart and will also
be the name for this chart when it is saved as a report object for
future use.
2. For this tutorial, in the Report Object Name box enter
Running Time by Workcell.
3. Click Next to continue.
The Filter dialog box appears. Now you will create a filter that will
specify which records will be charted. Since you only want to chart
the values for certain work cells, you will need to filter out the work
cells that you do not want to chart.
There are two types of filters that you can create:
• The static filter, where you provide all of the filter values when
you create the filter.
Step 7: Enter the Chart Title
Step 8: Filter the Data
190
Rockwell Automation Publication PLTMT-UM001M-EN-P-June 2014