Sensor-based calculations – PASCO Xplorer-GLX Users’ Guide User Manual
Page 51
X p l o r e r G L X U s e r s ’ G u i d e
45
See “Data Source” on page 15 for more information about selecting data in
the Graph.
•
You don’t have to use x as the undefined variable; whichever symbol you
leave undefined on the right side of the equation will be plotted on the hori-
zontal axis. However, the label on the horizontal axis will always read “x,”
even if the variable used in the calculation is not x.
Do not leave more than one symbol on the right side of the equation unde-
fined. If you do, the graph will use both of them as model ranges with confus-
ing results.
•
The text on the left side of the equation does not have to be y. The text to the
left of the equal sign is the name of that calculation, and will appear as the
vertical axis label on the Graph. It can consist of any combination of letters,
numerals, and spaces.
If you are defining more than one equation to be graphed, use different text
on the left side of each equation so that you can distinguish between them in
the data source menu of the Graph.
Sensor-based Calculations
You can create a calculation to automatically transform any data collected by a
sensor.
•
Connect a temperature probe to one of the ports on the left side of the GLX.
Press
to collect data for a few seconds. Press
again to stop.
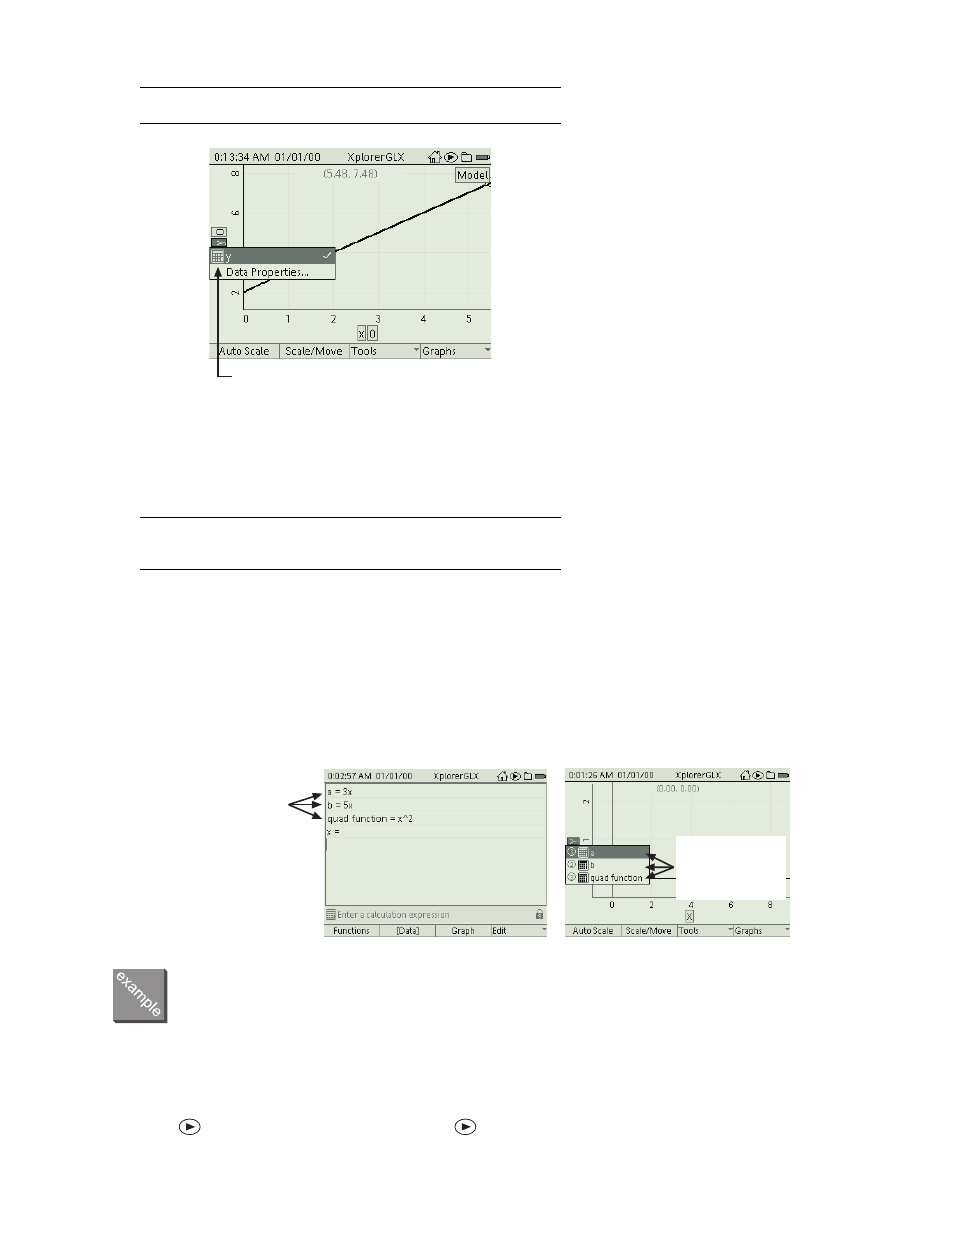
In the Graph, select the calculation from
the data source menu
Each equation can be
identified in the data
source menu of the
Graph by its unique
name
When defining
multiple equations
to be graphed,
give each a
unique name