PASCO Xplorer-GLX Users’ Guide User Manual
Page 126
120
N e w t o n ’ s L a w o f C o o l i n g
c)
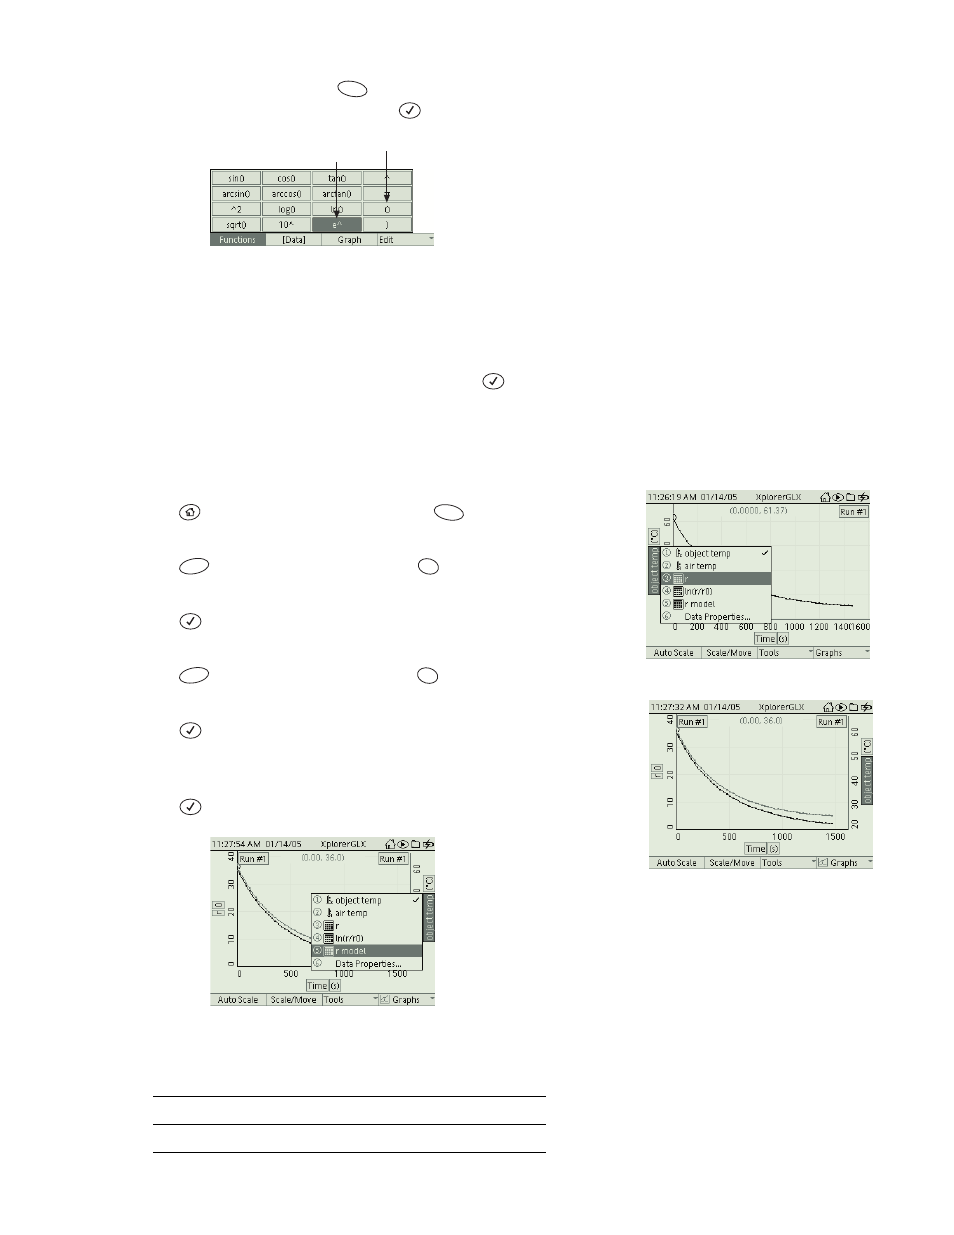
To insert the function e^, press
to open the Functions menu, use
the arrow keys to highlight e^, and press
.
Also open the Functions menu to select and insert the pair of parenthe-
ses.
d)
The Calculator will prompt you to enter the values of k and t. (It does
not prompt you for r
0
because you entered that constant in step 5.)
e)
Enter the value of k that you found in step 7 and press
.
f)
Time is the variable that will be plotted on the horizontal axis, so do not
enter a value for t.
9.
Compare collected relative temperature data with the modeled data.
a)
Press
to return to the Home Screen; press
to open the Graph
display.
b)
Press
to open the Graphs menu; press
to select New Graph
Page.
c)
Press
twice to highlight the data source menu. From the menu,
select r (the collected data).
d)
Press
to open the Graphs menu; press
to select Two Measure-
ments mode.
e)
Press
to turn on the highlight, then press the left arrow key repeat-
edly until the second data source (on the right side of the Graph) is high-
lighted.
f)
Press
to open the data source menu and select r model.
10. Does the modeled equation agree with the collected data? If it deviates,
can you explain why?
F1
e^ parentheses
F1
F4
7
?!
F4
4
ghi