PASCO Xplorer-GLX Users’ Guide User Manual
Page 115
X p l o r e r G L X U s e r s ’ G u i d e
109
2.
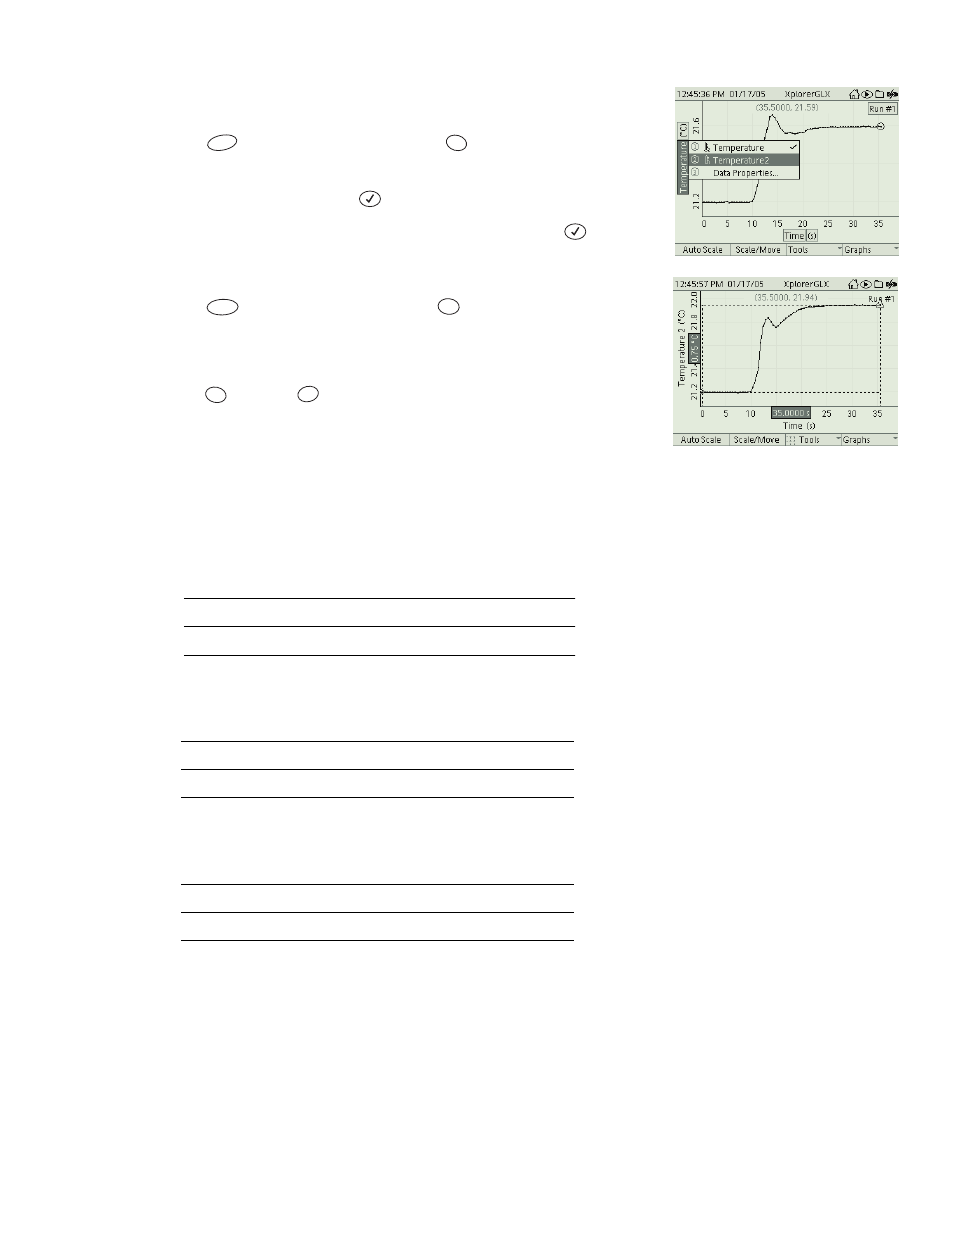
Create a new graph page showing only the temperature in Cup 2 versus
time.
a)
Press
to open the Graphs menu; press
to select New Graph
Page.
b)
On the new graph page, press
twice to open the data source menu.
c)
Press the down arrow key to highlight Temperature2 and press
.
3.
Use the Delta Tool to find the temperature change in Cup 2.
a)
Press
to open the Tools menu; press
to turn on the Delta
Tool.
b)
Press the up arrow to move one of the cursors to the first data point.
c)
Hold
and press
to swap control to the other cursor; press the
down arrow key to move that cursor to the last data point.
The Delta Tool should now show the changes in temperature and time
from the first to the last data point.
Cup 2 temperature change = _____________________
4.
How does the temperature change in Cup 2 compare to the temperature
change in Cup 1?
5.
If you repeated this experiment with three masses in Cup 2, what do you
think the temperature change of Cup 2 compared to Cup 1 would be?
6.
Why did this experiment call for Styrofoam rather than glass contain-
ers?
F4
7
?!
F3
2
tuv
Esc
Х