Data collection, Analysis – PASCO Xplorer-GLX Users’ Guide User Manual
Page 131
X p l o r e r G L X U s e r s ’ G u i d e
125
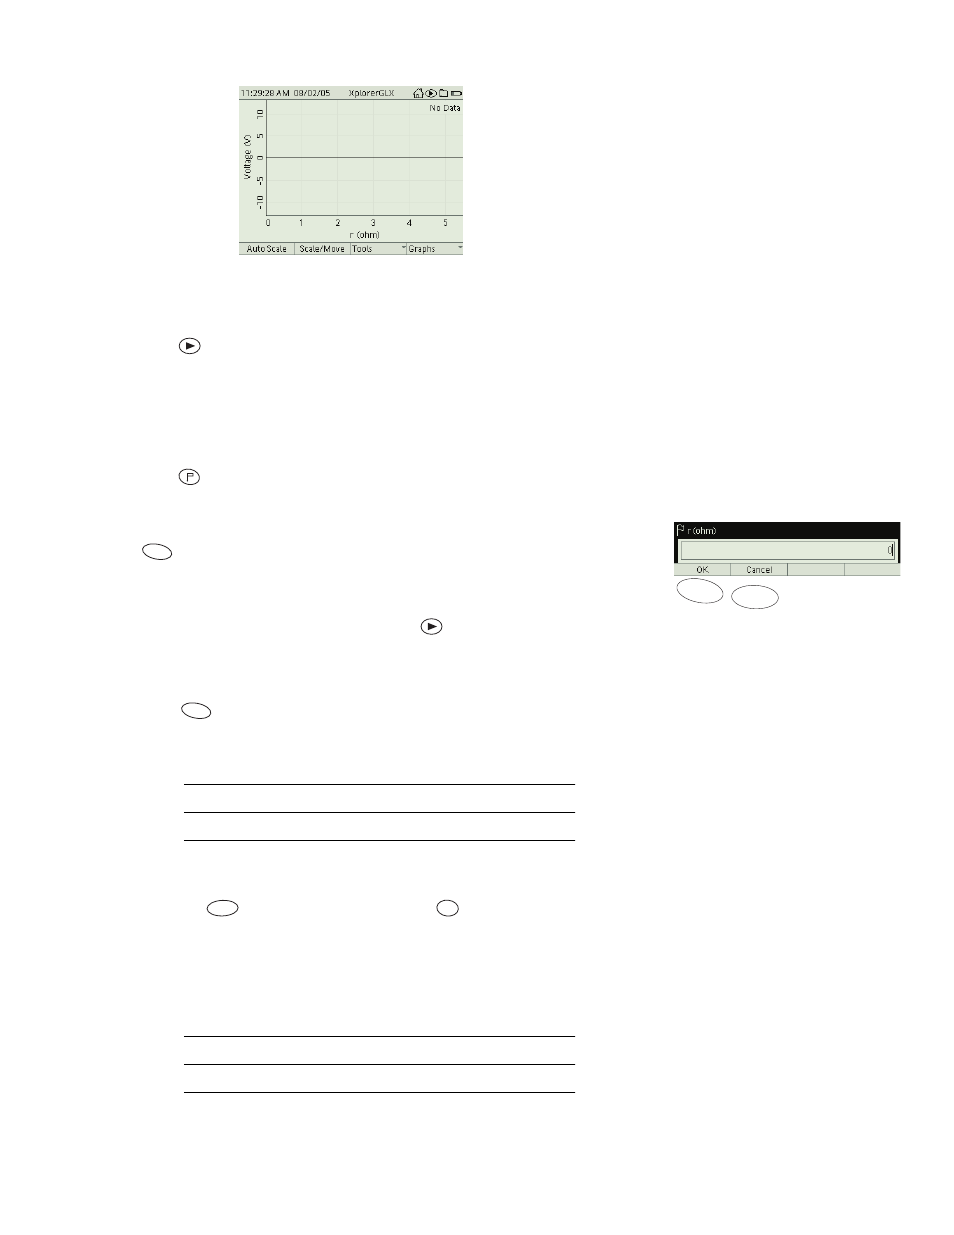
Graph prepared to plot
V vs. r
Data Collection
1.
Press
. The GLX is now measuring voltage, but it is not recording data.
2.
Connect the black lead of the voltage probe to the negative terminal of the
battery.
3.
Place the red lead of the probe in contact with the circuit at point A.
4.
Press
to record a single voltage measurement.
5.
The GLX will prompt you to enter r, the total resistance across which the
voltage is measured. (For point A, r = 0.) Type the value of r and press
.
6.
Repeat steps 3, 4, and 5 for points A through F.
7.
When you are finished recording data, press
.
Analysis
1.
Press
to automatically scale the Graph.
2.
Does your data appear to agree with your prediction?
3.
Apply a linear fit to the graph and find the slope.
a)
Press
to open the Tools menu; press
to select Linear Fit.
b)
What is the slope (including units) of the best-fit line?
slope = __________
c)
What physical quantity does the slope represent?
F2
F1
F1
F1
F3
5
jkl
- UI-5000 850 Universal Interface Quick Start (1 page)
- UI-5000 850 Universal Interface Instruction Manual (24 pages)
- PS-2193 High Current Sensor (2 pages)
- ME-8979 Mass and Hanger Set (1 page)
- ME-9498A Photogate Head (3 pages)
- ME-6821A Photogate Mounting Bracket (2 pages)
- ME-6825A MINI LAUNCHER (39 pages)
- ME-6810 Time of Flight Accessory (24 pages)
- ME-8574 DISCOVER FRICTION ACCESSORY (4 pages)
- PS-2103A Motion Sensor (4 pages)
- PS-2189 High Resolution Force Sensor (2 pages)
- ME-9448B Super Pulley with Clamp (2 pages)
- ME-6955 1.2 m PAScar Dynamics System (27 pages)
- PS-2104 Force Sensor (2 pages)
- ME-8998 Elastic Bumper Kit (2 pages)
- ME-6843 Spring Cart Launcher (9 pages)
- ME-6950 PAScar with Mass (29 pages)
- PS-2120A Rotary Motion Sensor (9 pages)
- PS-2120A Rotary Motion Sensor (17 pages)
- ME-9821 Centripetal Force Pendulum (18 pages)
- ME-8088 Centripetal Force Apparatus (20 pages)
- ME-8735 Large Rod Stand (2 pages)
- CI-6545 Force Accessory Bracket (3 pages)
- ME-9806 Photogate Brackets (1 page)
- CI-6692 IDS MOUNT ACCESSORY (2 pages)
- ME-6569 RMS_IDS KIT (36 pages)
- ME-6829 Mini Launcher Ballistic Pendulum (18 pages)
- ME-9889 Discover Free Fall System (10 pages)
- SE-7256 Motion Sensor Guard (2 pages)
- ME-8973 Discover Collision Bracket (2 pages)
- AP-8214A Stress_Strain Apparatus (12 pages)
- CI-6691 MINI-ROTATIONAL ACCESSORY (2 pages)
- ME-9833 Physical Pendulum Set (30 pages)
- OS-8473 POLARIZER SET (2 pages)
- PS-2343 USB Camera (2 pages)
- AP-8215A Gravitational Torsion Balance (20 pages)
- OS-8526A X-Y ADJUSTABLE DIODE LASER (2 pages)
- PS-2150 Broad Spectrum Light Sensor (2 pages)
- PS-2164 Quad Pressure Sensor (3 pages)
- PS-2200 Load Cell, 100 N (3 pages)
- PS-2205 Dual Load Cell Amplifier (5 pages)
- PS-2107 Absolute Pressure Sensor (2 pages)
- PS-2102 pH Sensor (3 pages)
- PS-2119 Acceleration Sensor (2 pages)