Lv1_chapter1.pdf – Waves eMotion LV1 64-Channel Mixer with Axis One Custom Computer User Manual
Page 52
47
Waves eMotion LV1 User Guide |
Chapter 1: Setup Window
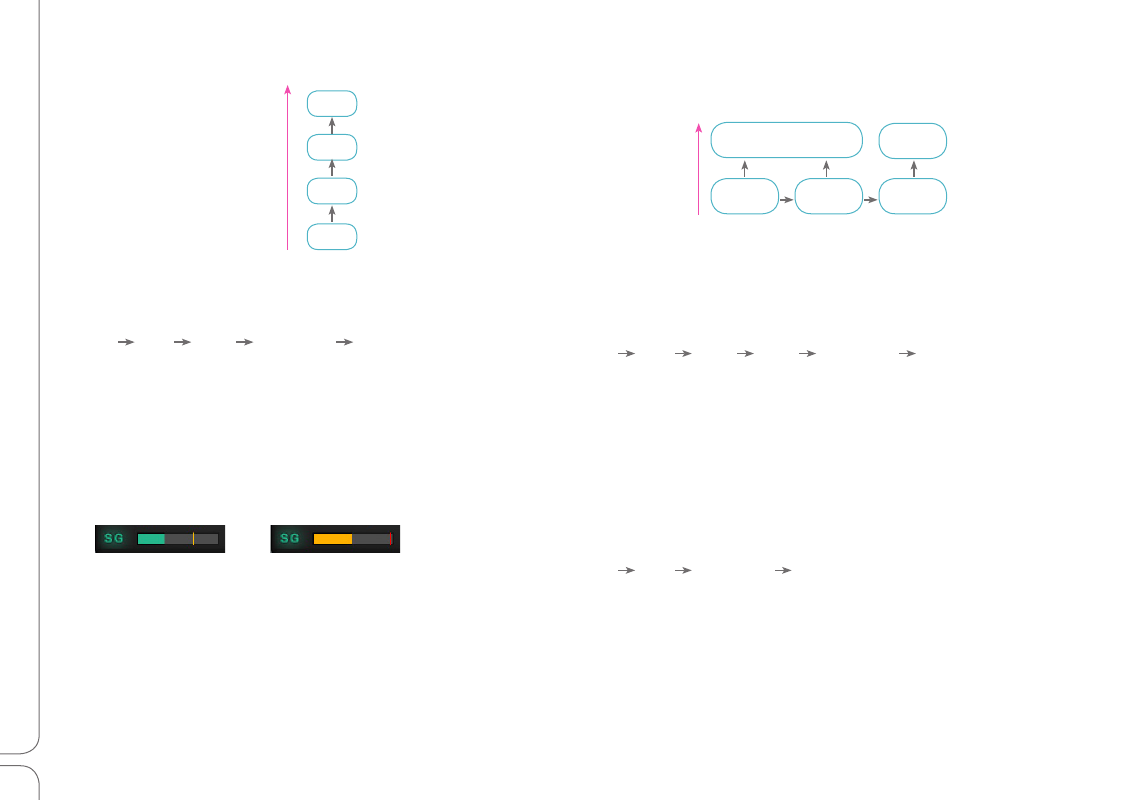
DSP Optimized
Example (DSP Optimized Mode)
I/O Input Group Master Aux Monitor I/O
Latency = 16 samples
In the DSP Optimized mode, latency is determined by mixer
internal routing. There’s better CPU headroom and efficiency,
but processing paths spanning several buffer cycles can
result in greater latency.
Certain paths will have zero latency, even in the DSP
Optimized mode.
Example (DSP optimized Mode)
I/O Input Aux Monitor I/O
Latency = 0 samples
t
= Server Network Buffer + sum of all B paths
Aux (2) Monitor
Input
Group
Aux
Main
B
B
B
B
B
t
Latency Optimized
Example (Latency Optimized Mode)
I/O Input Group Aux Monitor I/O
Latency = 0 samples
In the Latency Optimized mode, processing takes place in
a linear manner. All processing must be completed within one
buffer cycle. There is no added latency in mixing, but plugins that
exhibit large processing spikes can delay the entire processing
chain beyond the limits of the network buffer. This is indicated
on the DSP meter as a large average/peak DSP ratio (left).
The green area displays average DSP use. The orange line shows
peak use. If this ratio is especially large, the processor may
overload. A yellow meter (right) indicates that peak DSP load
has reached 85%. Adjust your DSP use immediately, or you may
encounter drops. Remove or disable whatever plugins you can.
If this doesn’t help, then switch to the DSP Optimized mode.
Main
t
= Determined by Network Server Buffer only
Input
Group
Aux
t